
Inflation remains a hot topic, directly impacting everything from your grocery bill to interest rates. As of September 2025, two key inflation gauges — the Personal Consumption Expenditures (PCE) Price Index and the Consumer Price Index (CPI) — show that prices are still above the Federal Reserve’s 2% target, with the core PCE at 2.8% and core CPI at 3.0%.
The Fed’s Preferred Inflation Gauge
The Fed is on record as using PCE data as its primary inflation gauge, with a 2% target rate. Elsewhere, the Fed has stressed the importance of “core” inflation, which excludes food and energy prices which tend to be more volatile.
Finally, policymakers examine a variety of “core” inflation measures to help identify inflation trends. The most common type of core inflation measures excludes items that tend to go up and down in price dramatically or often, like food and energy items. For those items, a large price change in one period does not necessarily tend to be followed by another large change in the same direction in the following period. Although food and energy make up an important part of the budget for most households — and policymakers ultimately seek to stabilize overall consumer prices — core inflation measures that leave out items with volatile prices can be useful in assessing inflation trends. [Source]
In their last meeting, the Fed implemented a widely anticipated 25 basis point cut to the federal funds rate (FFR), bringing it to a range of 4.00%-4.25%. This marked the first rate cut of the year, with two more quarter-point cuts anticipated before year end. The statement from the meeting revealed the Committee believes “inflation has moved up and remains somewhat elevated,” but that they are strongly committed to returning inflation to its 2% objective.
The Fed will meet again this week where they are expected to continue to cut rates. At the time of writing, the CMEFedWatch Tool shows an 87% likelihood the Fed will cut rates by 25 basis points versus a 13% likelihood they will hold rates steady.
PCE and CPI: A Side-by-Side Inflation Comparison
So, why does the Federal Reserve pay more attention to core PCE than core CPI when assessing its progress in managing inflation? A side-by-side comparison reveals key differences.
One of the primary reasons is volatility. Core PCE tends to be considerably less volatile than core CPI. This stability makes it a more reliable indicator for the Fed, which has a dual mandate of achieving price stability and maximum employment. Historically, the less erratic nature of core PCE has made it the preferred metric of choice, though the disinflationary trend in core PCE prior to 2022 casts doubt on the effectiveness of the Fed’s monetary policy.
PCE and CPI: Historical Trends of Inflation
A long-term look at both the Consumer Price Index (CPI) from the Bureau of Labor Statistics and the Personal Consumption Expenditures (PCE) Price Index from the Bureau of Economic Analysis reveals that while they generally track each other, core CPI consistently shows more volatility.
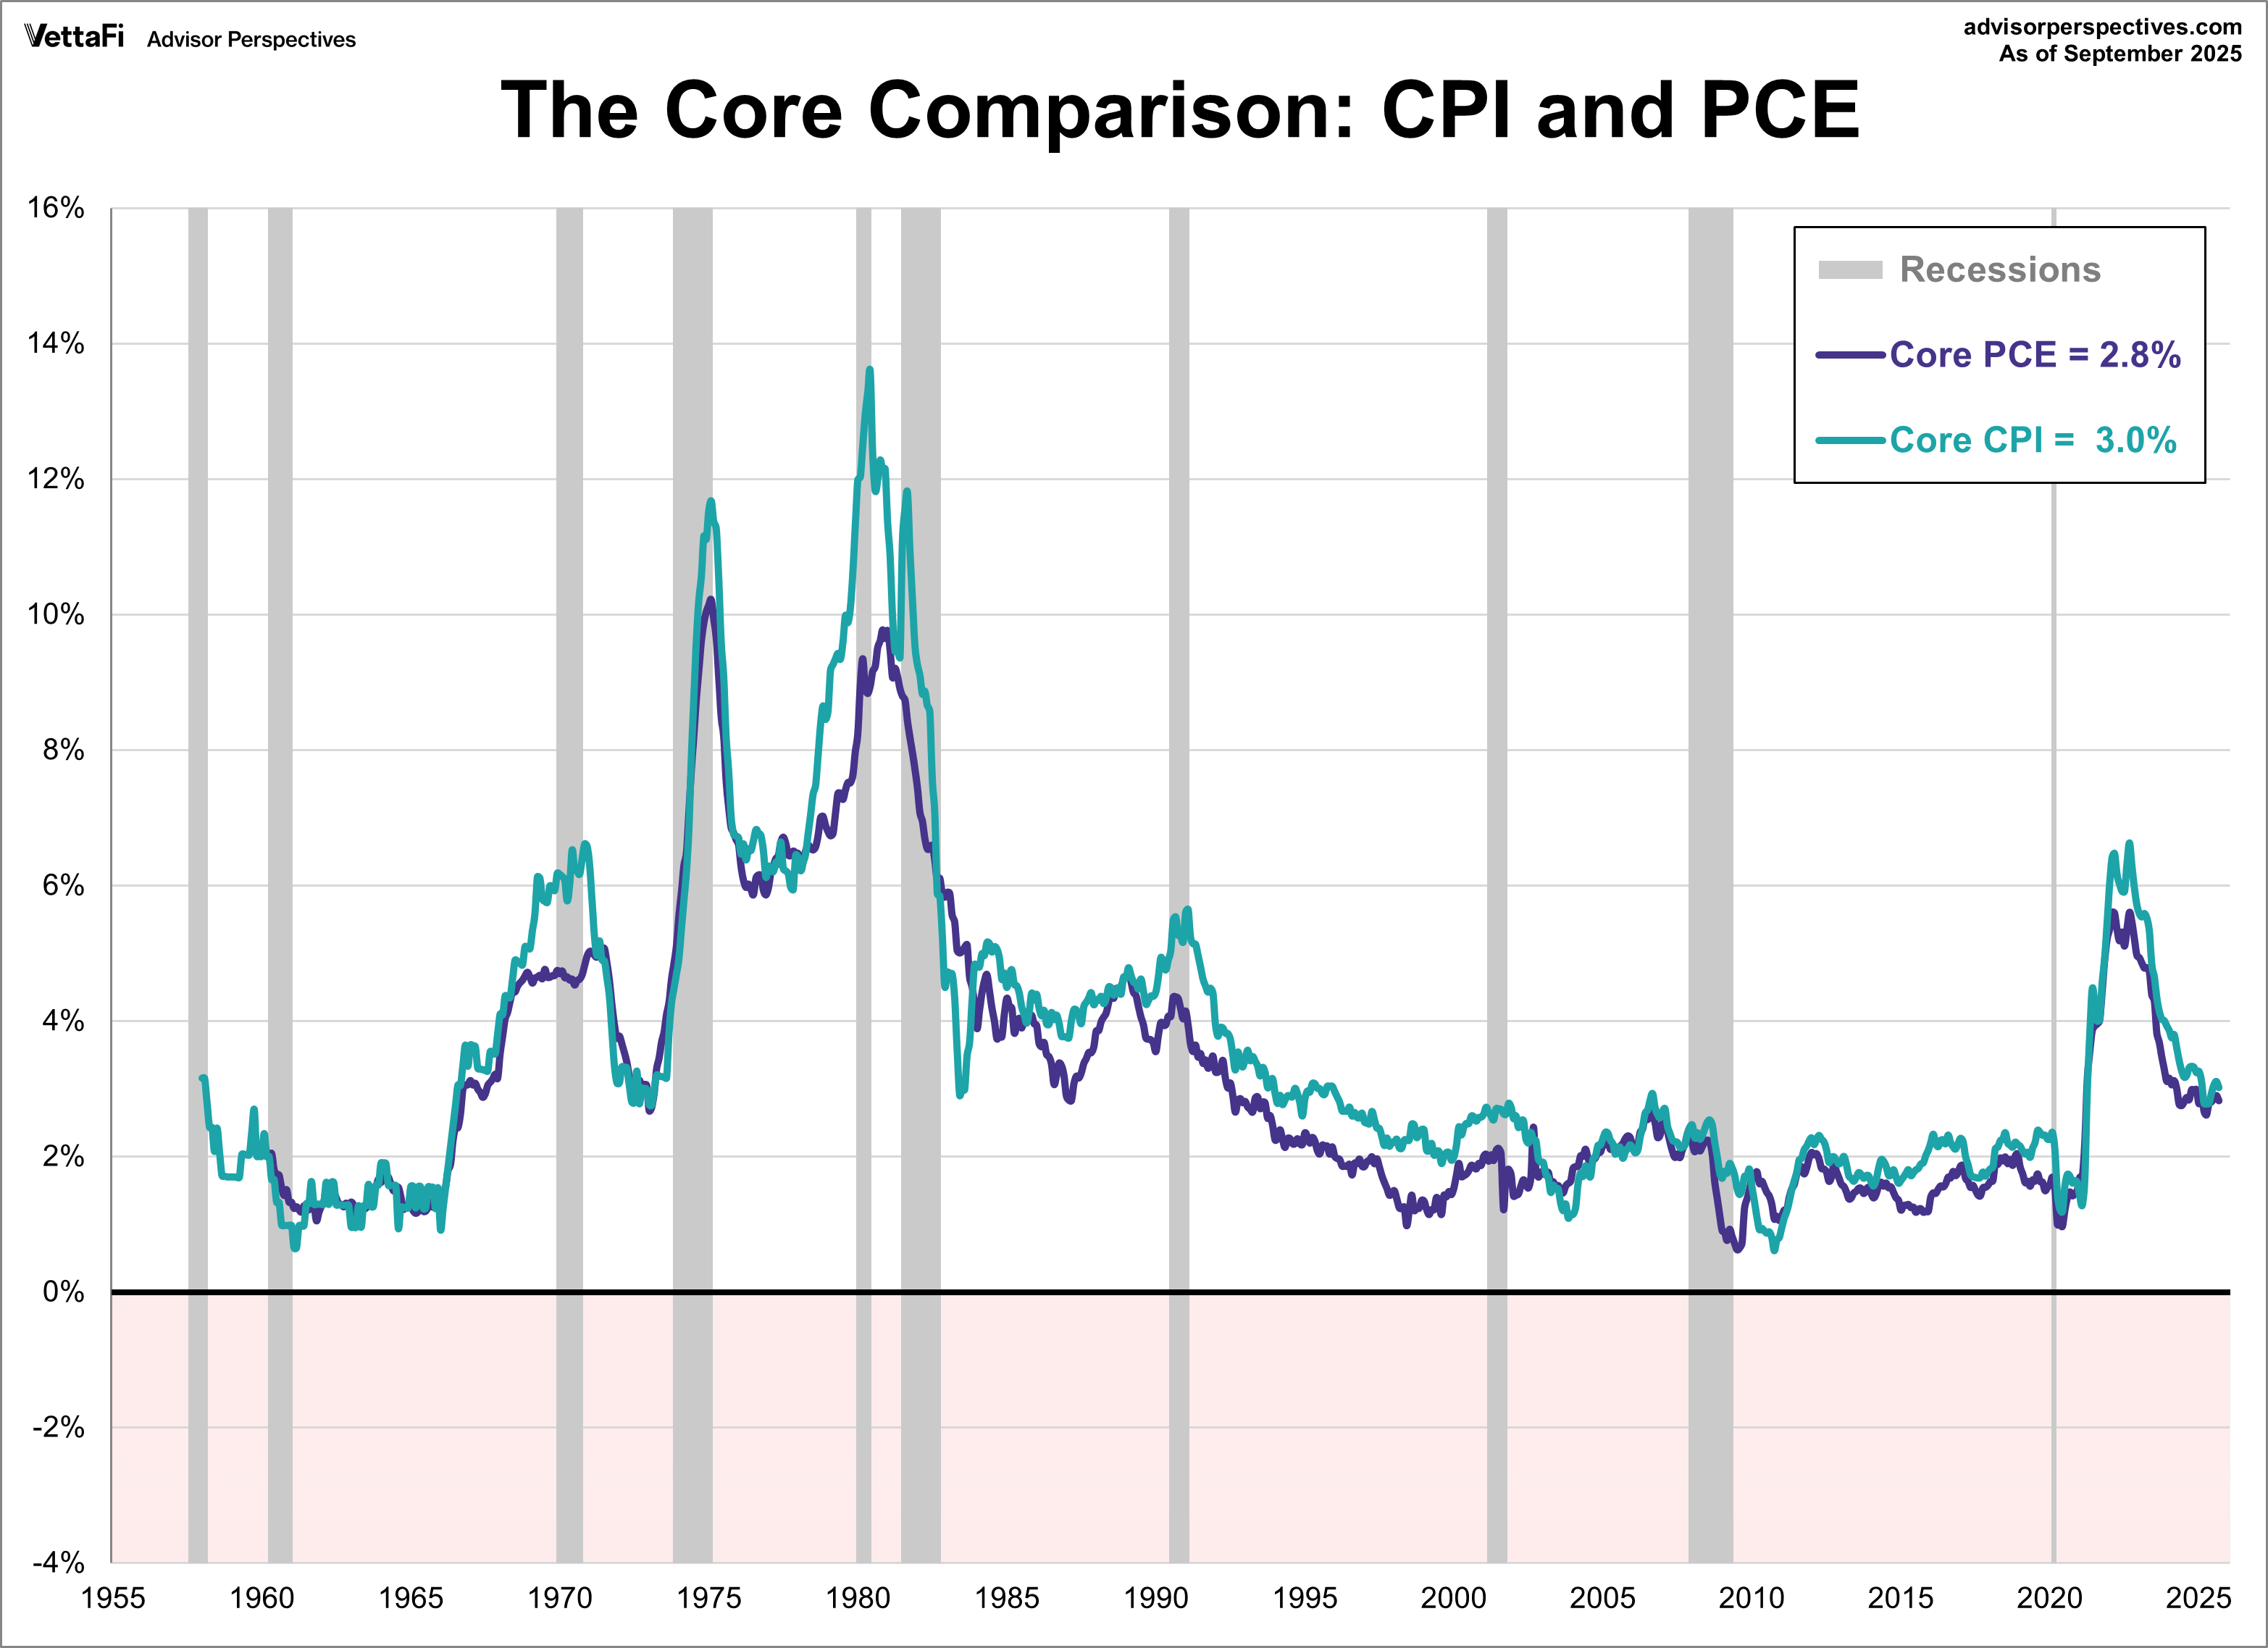
Zooming in on the 21st century, the pattern persists. While inflation remained below 3% before 2021, the COVID-19 pandemic triggered the highest rates since the early 1980s. Core PCE peaked at 5.57% in February 2022, and core CPI followed in September at 6.63%. Although both have since declined, recent data shows inflation has been stalling above the Fed’s 2% target.

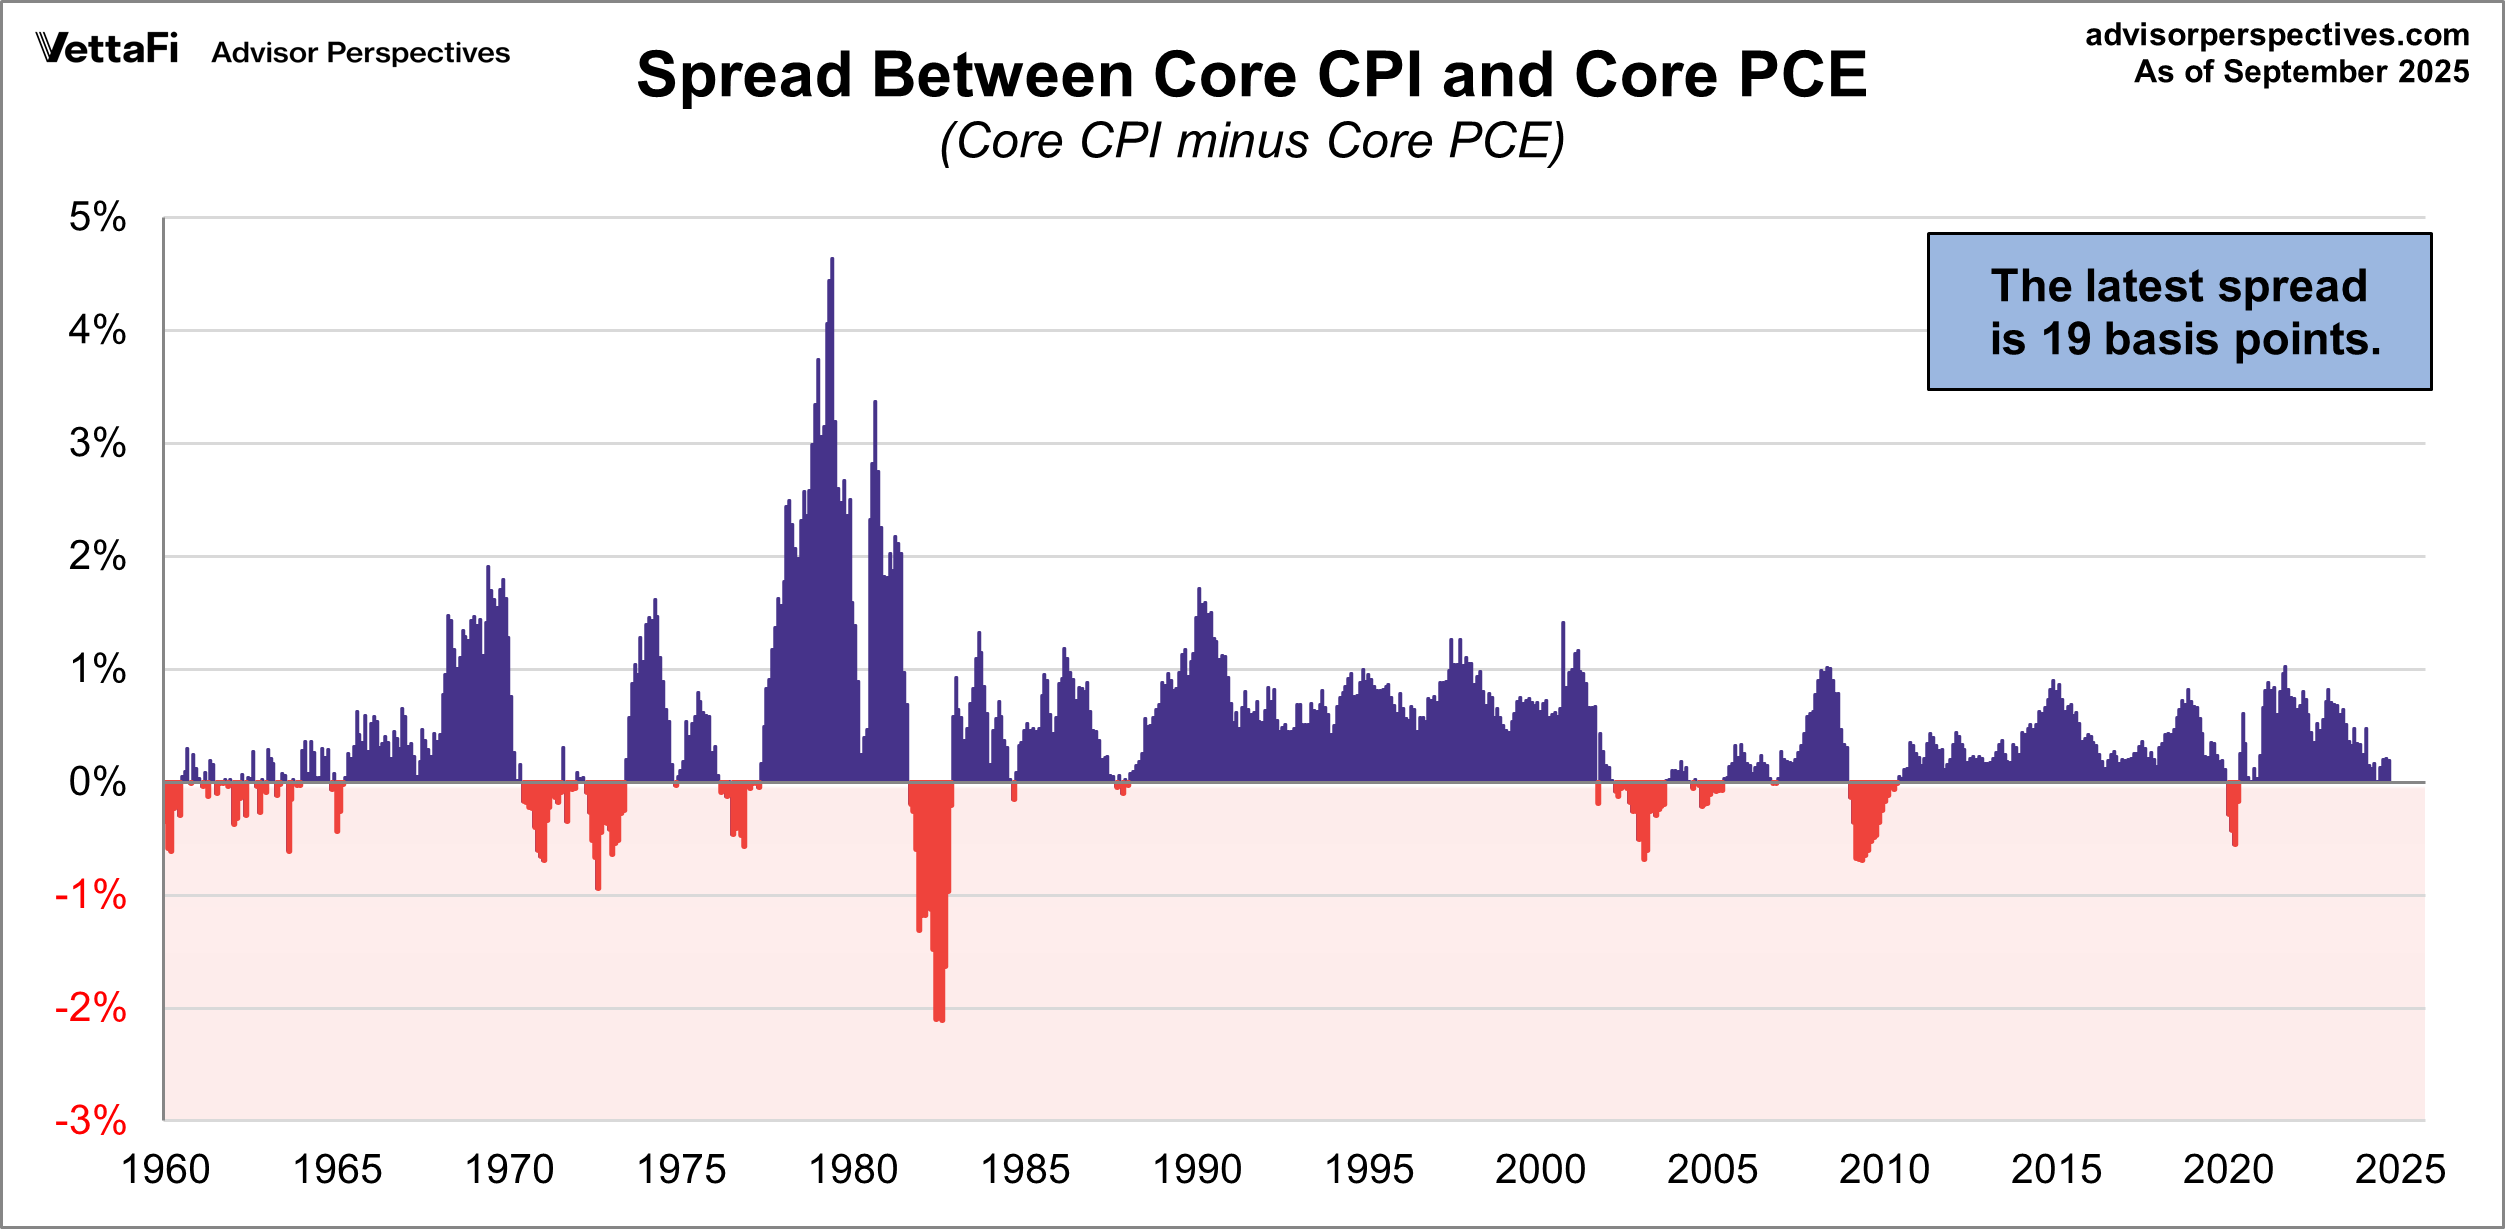
PCE and CPI: Examining the Inflation Discrepancy
In the previous two charts, it was easy to see that core CPI tends to be higher than core PCE. Since 1960, it has registered a higher reading nearly 80% of the time. On average, core CPI has been 48 basis points, or 0.48%, higher than core PCE. As of September 2025, the gap has narrowed to 19 basis points, or 0.19%.
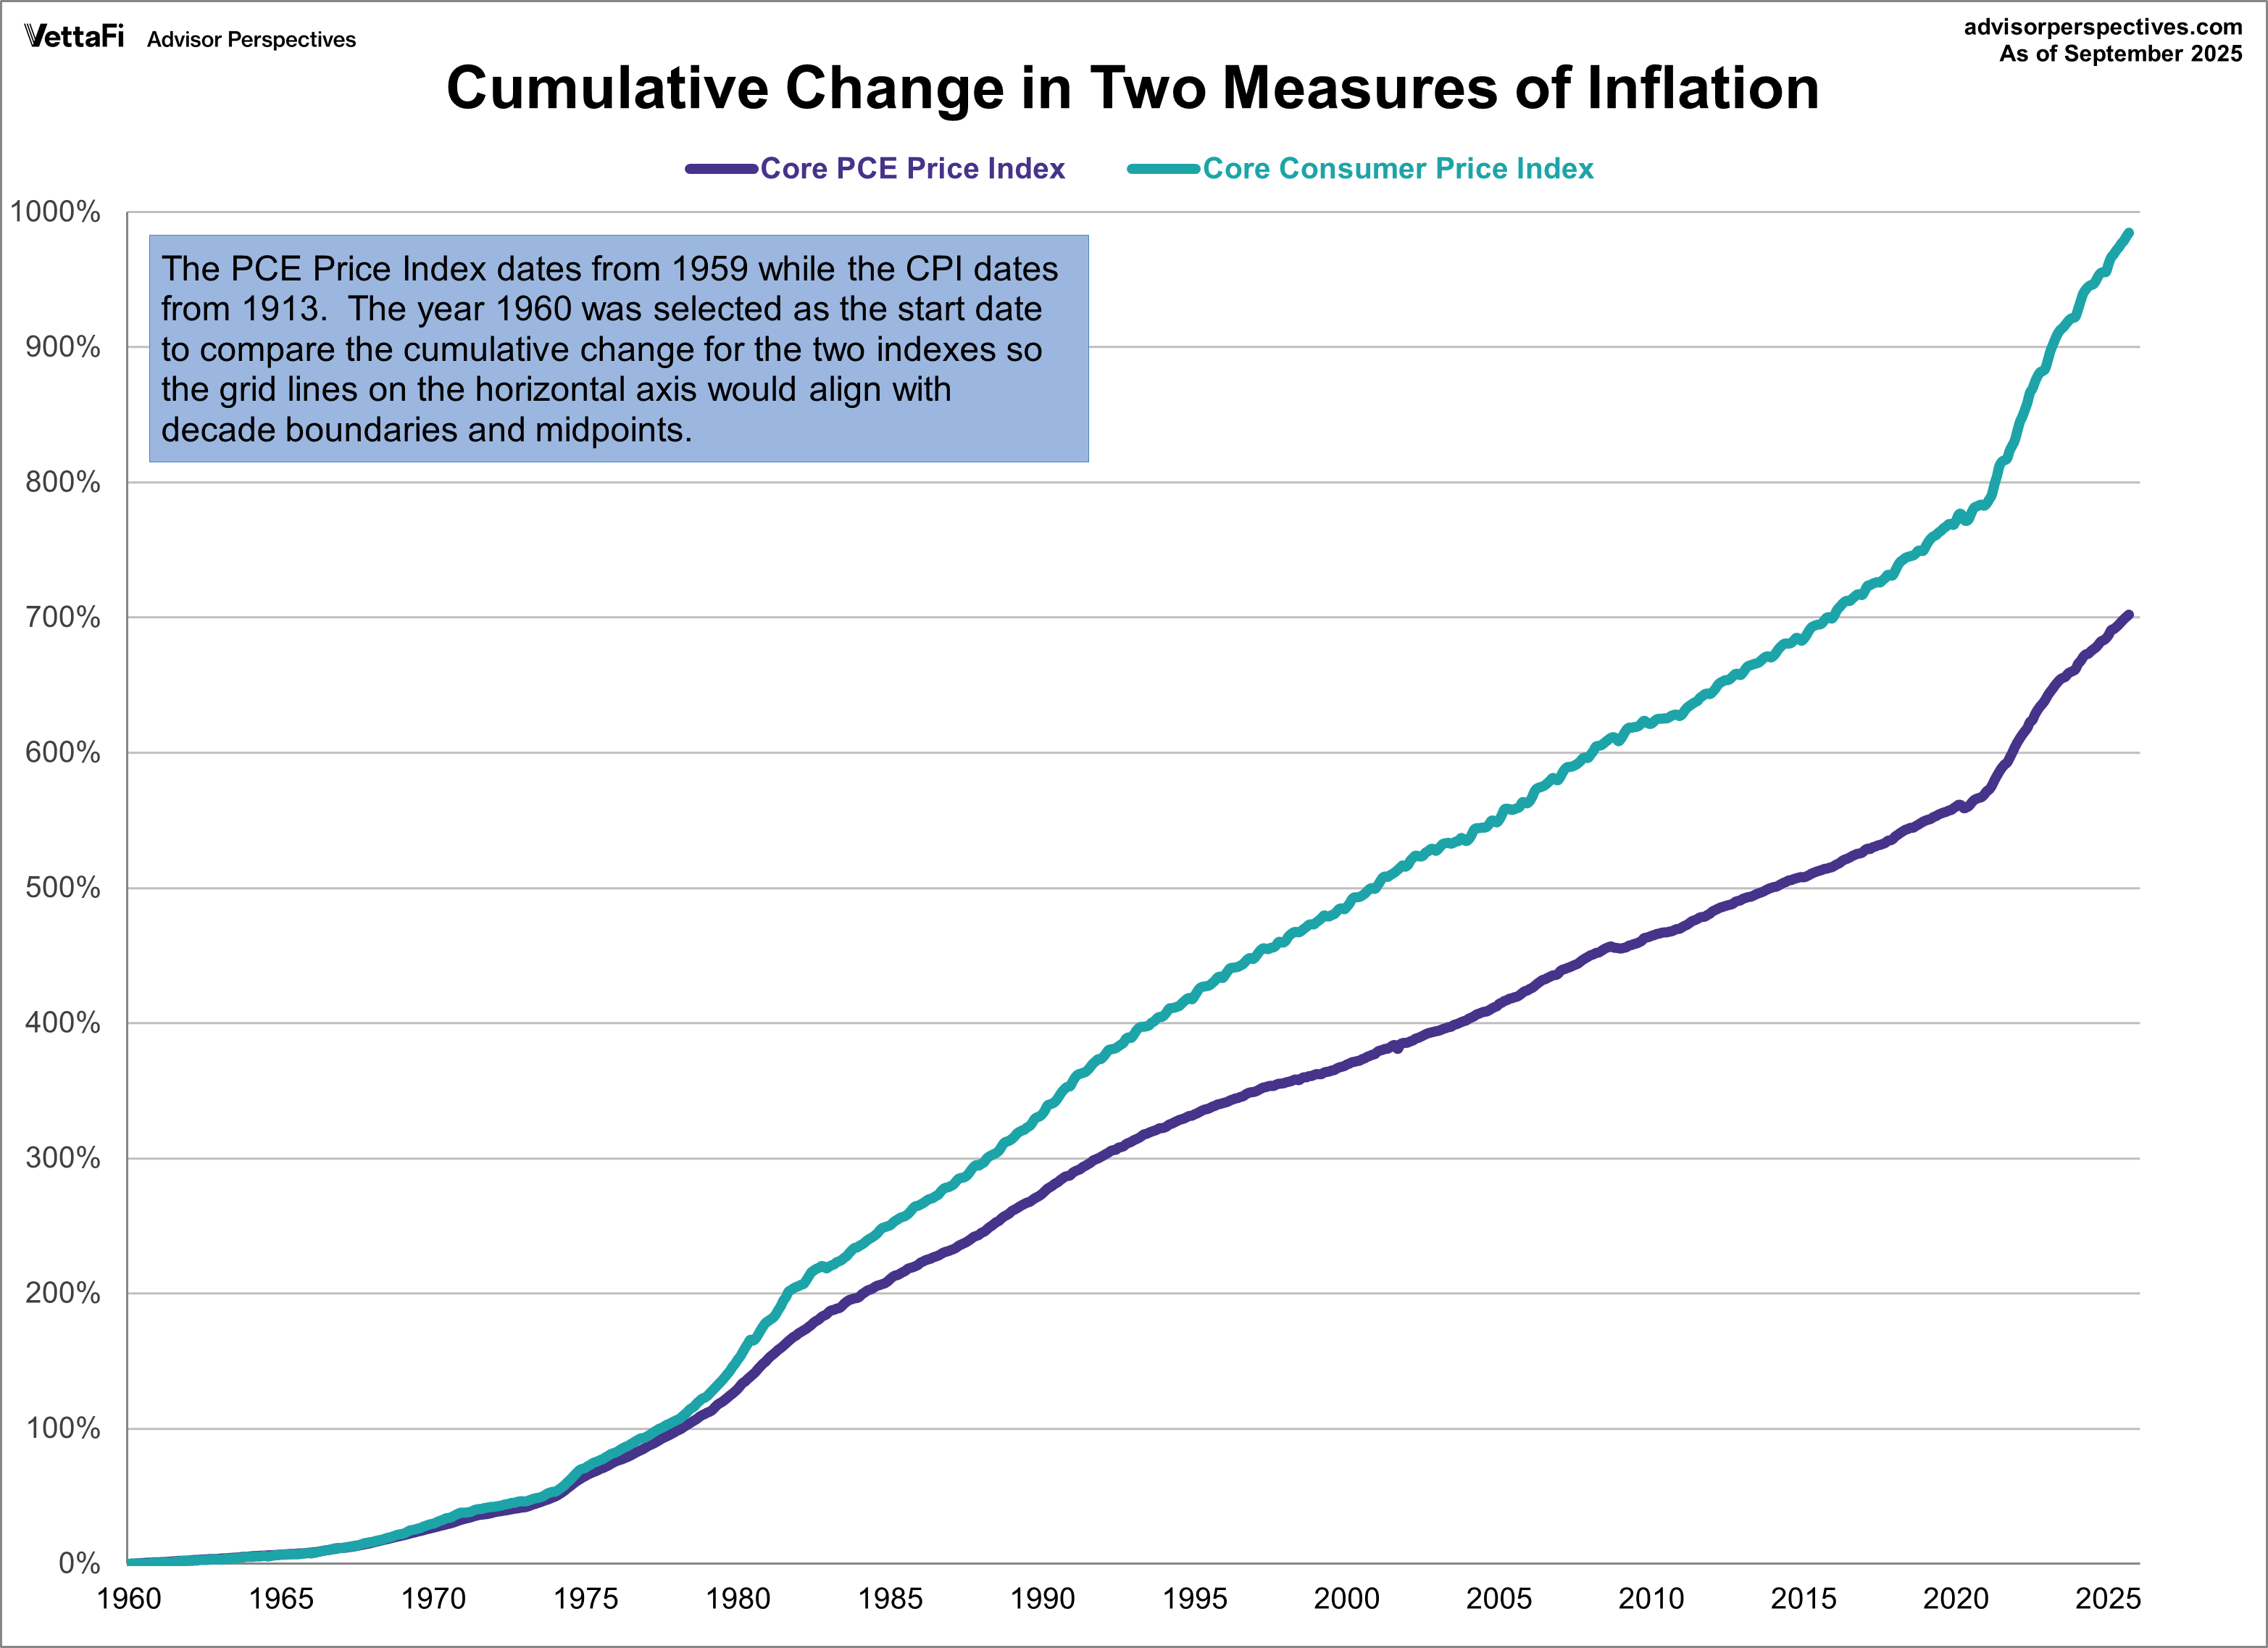
PCE and CPI: A Tale of Two Inflation Growths
Here is a chart that helps us compare the cumulative change in the two indexes since 1960. The two grew at similar rates up until around 1980. However, over time, the core PCE indicates significantly lower inflationary growth. As of September 2025, core CPI has grown 985% since 1960, while core PCE has only grown almost 1/3 less at 702%.
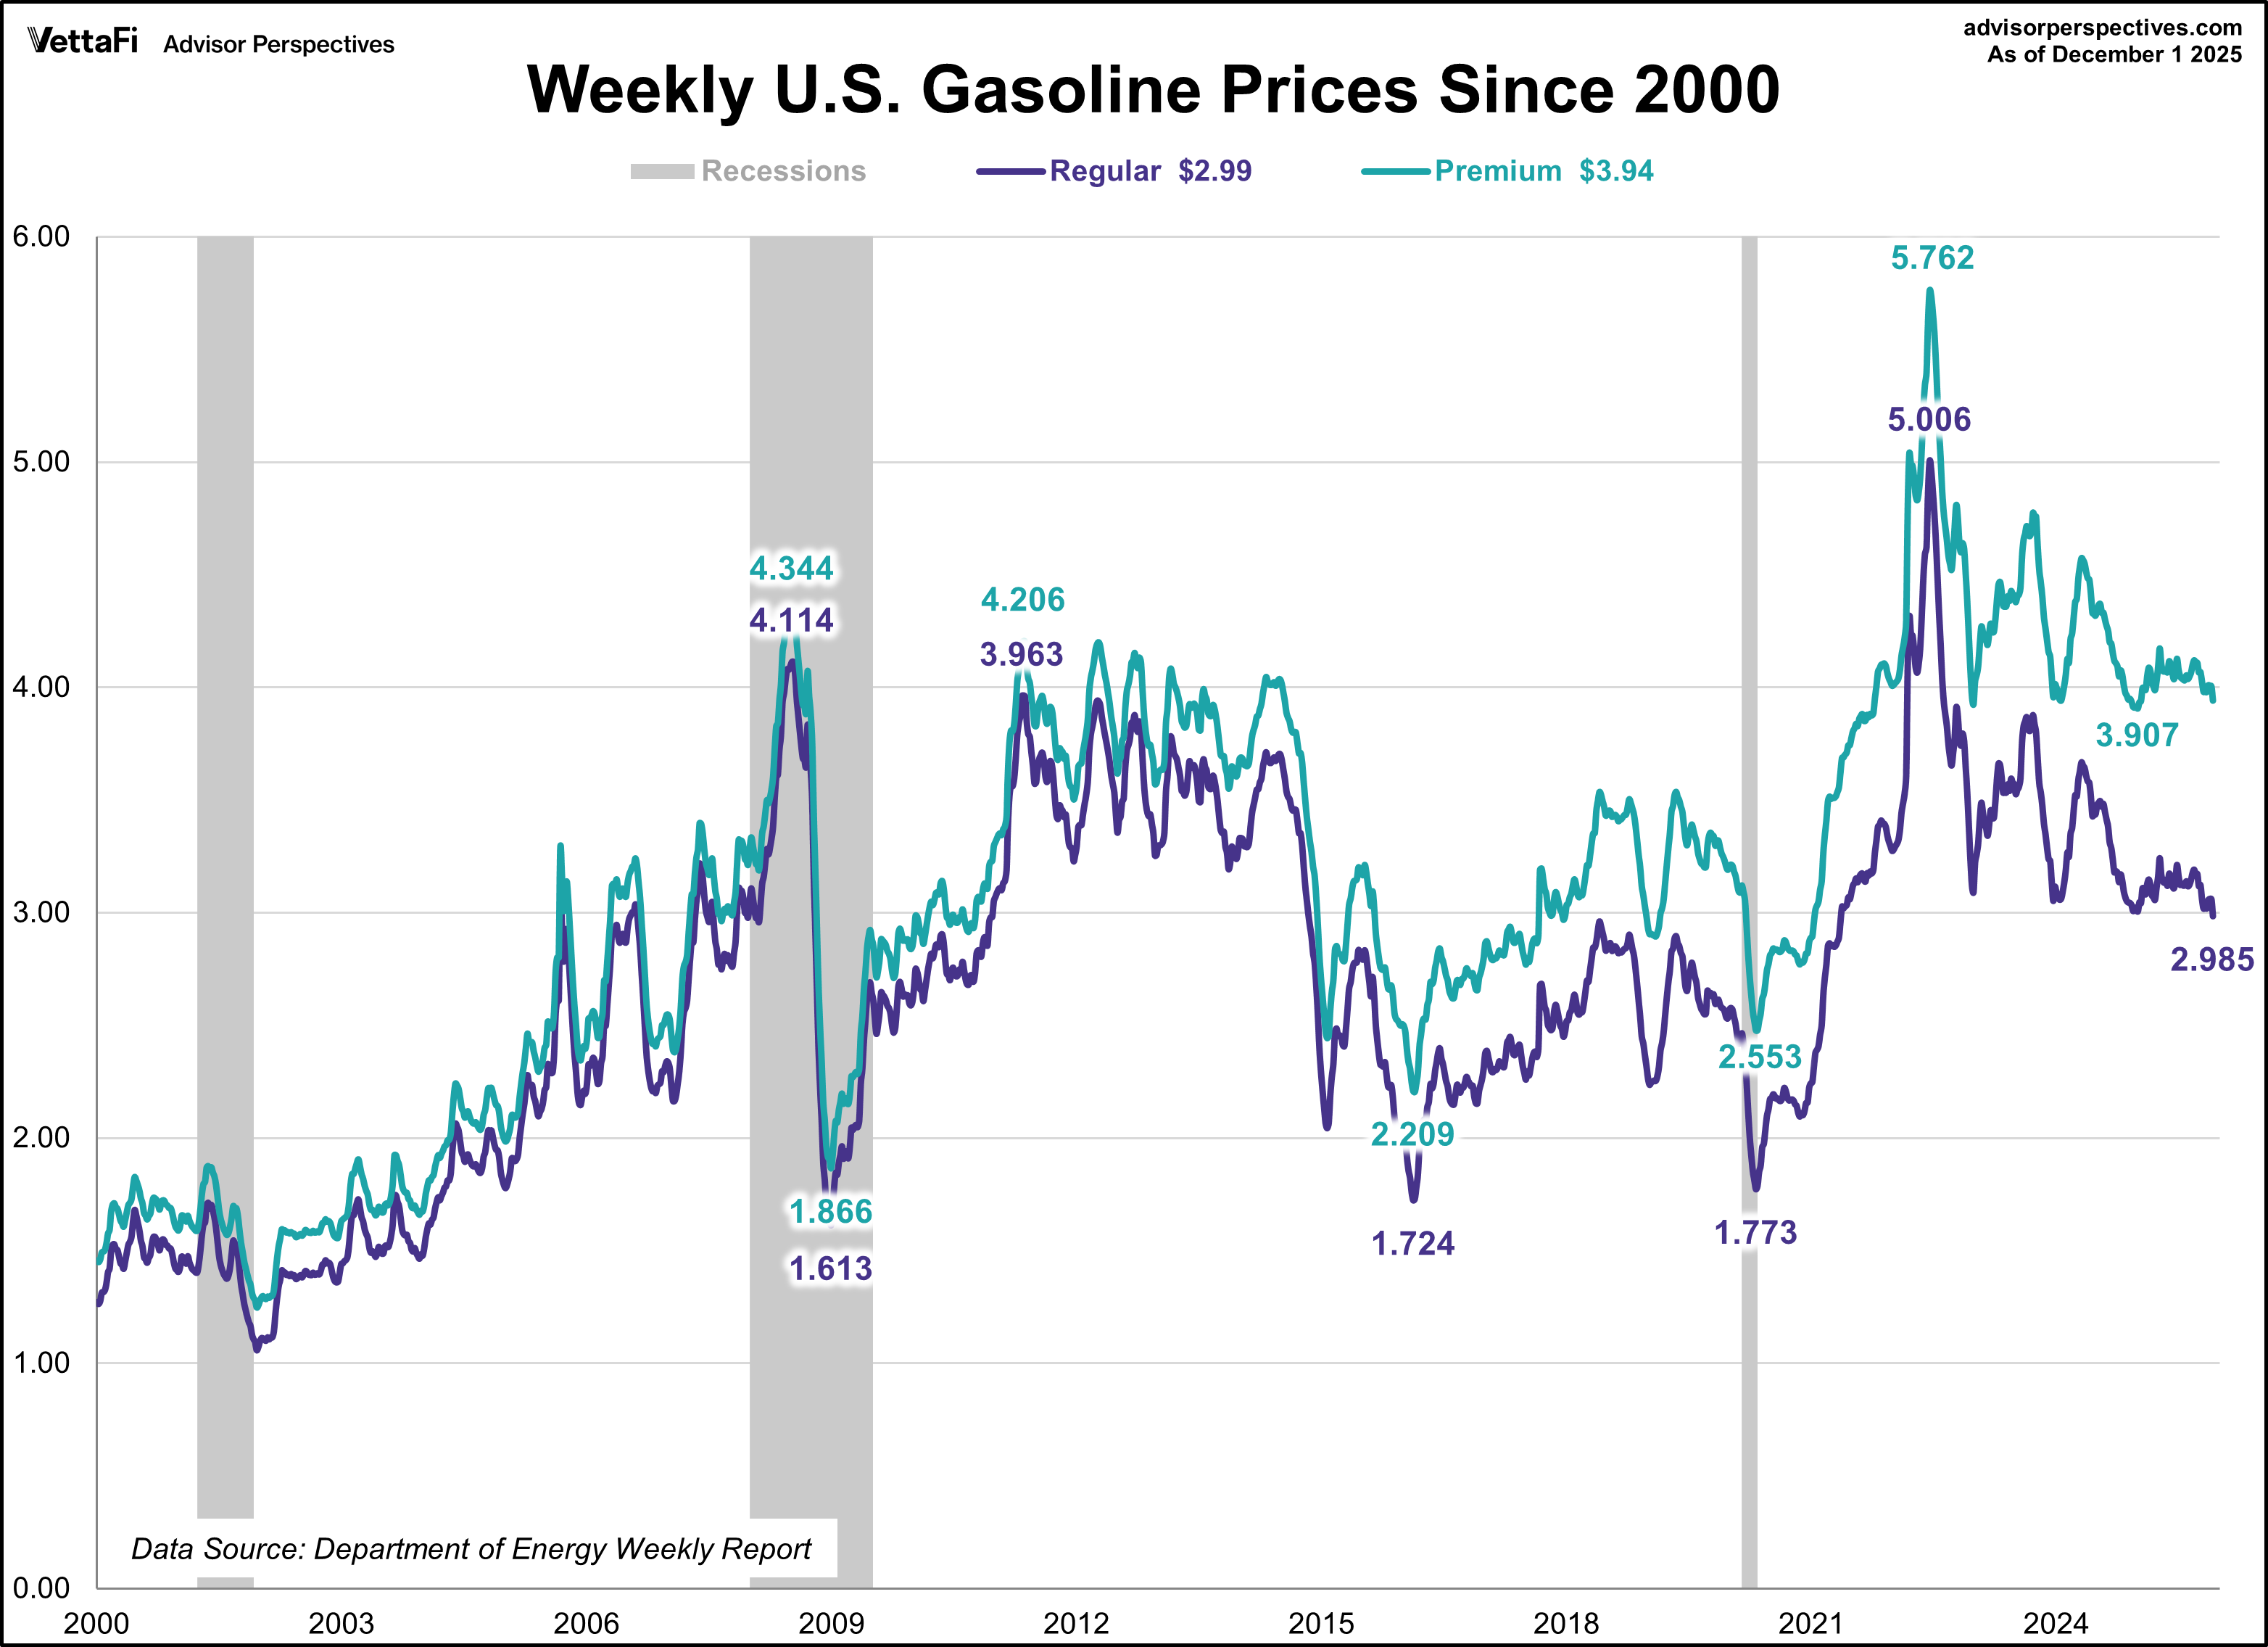
Why Core Inflation Can Be Misleading
While “core” inflation helps economists identify trends, it’s easy to understand why so many people are confused by the exclusion of food and energy from core measures of inflation. After all, these are essential monthly expenses. But the extreme volatility of prices for items like gasoline, as shown in the chart below, often obscures the underlying inflationary trends that policymakers are focused on.
For some technical data explaining the differences between the calculation of PCE and CPI, see this comparison article from the BEA.
During inflationary times, investors sometimes turn to agricultural commodity ETFs such as Teucrium Wheat Fund (WEAT) and Teucrium Corn Fund (CORN).