
With the NCAA tournament beginning in just a few days, we’ve applied the bracket format to our own research. While economic theory often dictates what should be most important to investors, our reader engagement reveals which topics truly commanded investor attention over the past year.
Tournament Rules
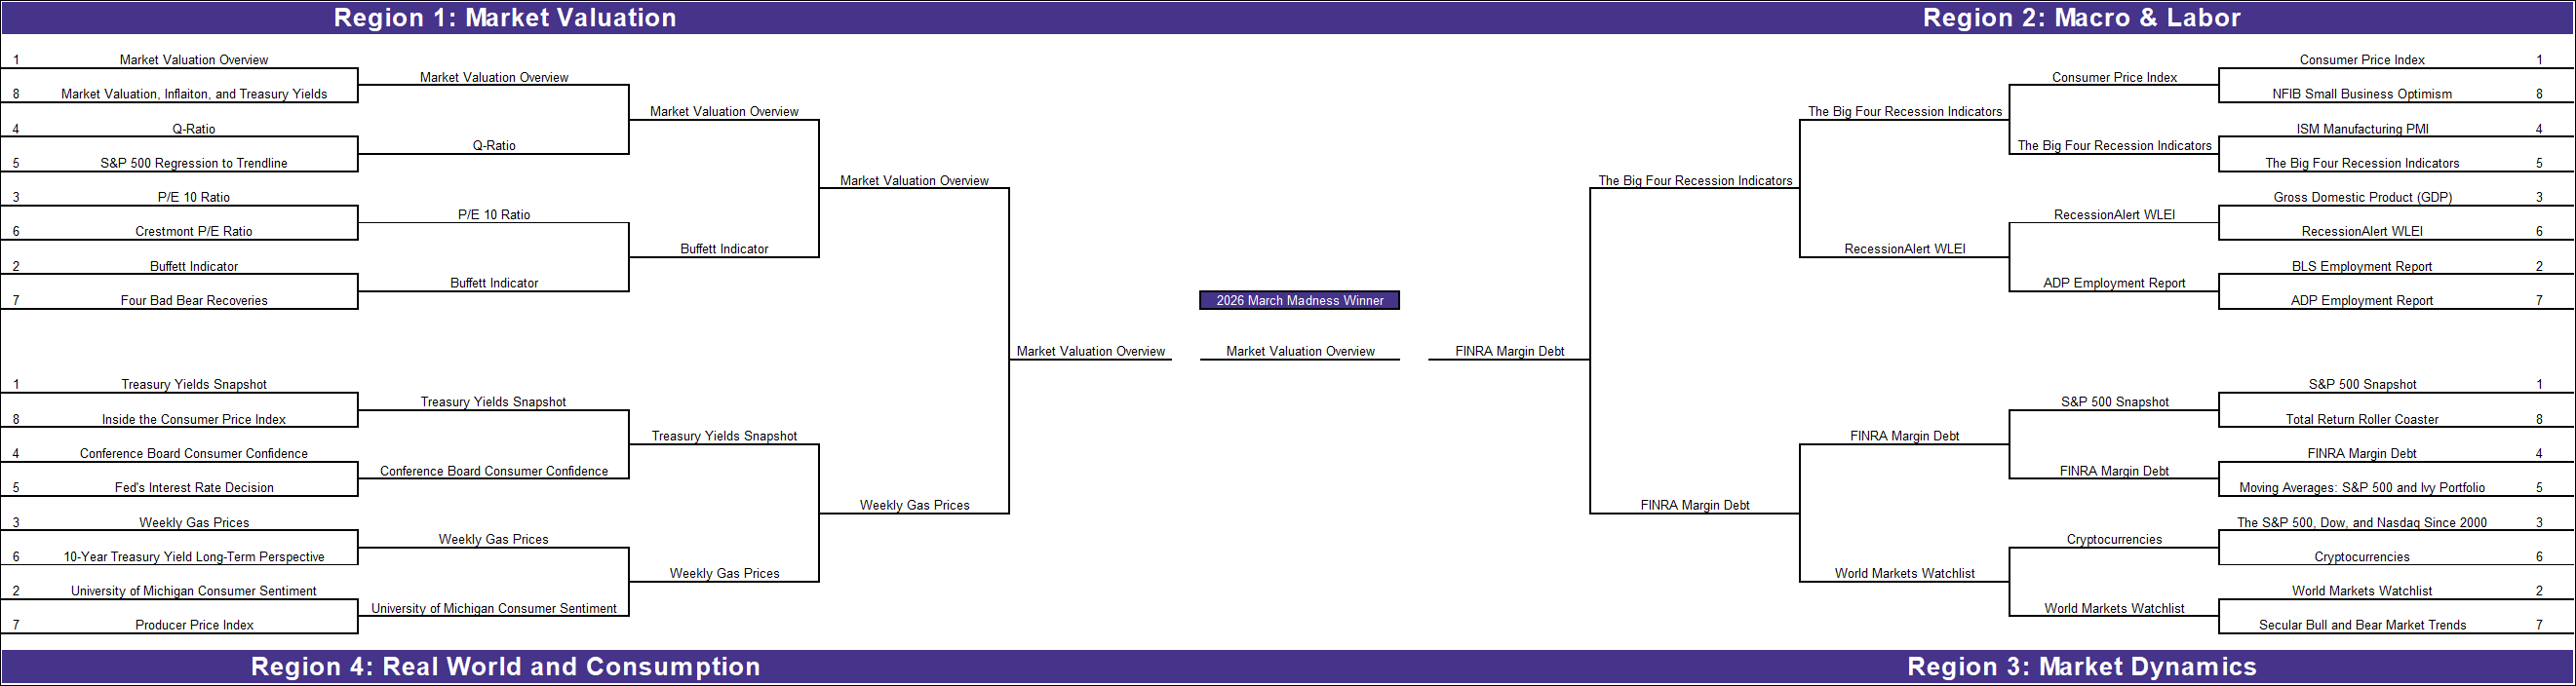
Articles are ranked #1 through #8 in each region based on “Perceived Importance”. The winner of each matchup is determined strictly by total engagement from March 2025 through February 2026, revealing where readers spent their time. The bracket images below contain significant detail. For the best experience, click each image to enlarge or refer to the regional deep-dive sections for specific matchups.
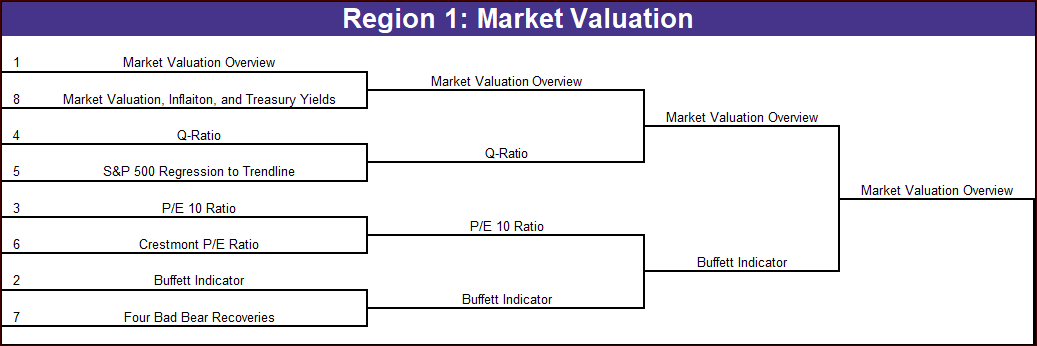
Region 1: Market Valuation
This region features our traditional valuation models and is considered the tournament’s “Power Conference.” The strength in readership for this region suggests that regardless of the news cycle, our readers are most focused on long-term trends and the fundamental question of market price.
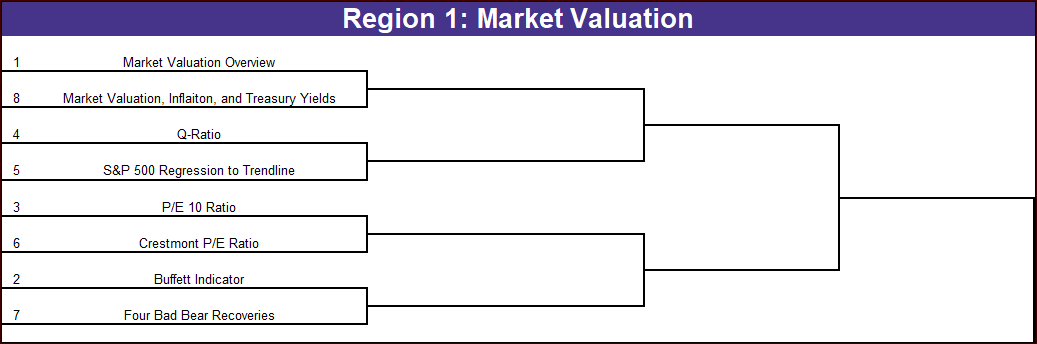
#1 Market Valuation Overview vs. #8 Market Valuation, Inflation, & Yields: The heavyweight champion of our library faces off against a multi-variable report. This is a battle of broad market overview versus a more correlated view of the market.
#2 Buffett Indicator vs. #7 Four Bad Bear Recoveries: A clash between a “macro” favorite (Market Cap to GDP) and historical context. Investors often look to Buffett for the “now,” but historical bear market data can provide the “what’s next.”
#3 P/E 10 Ratio vs. #6 Crestmont P/E Ratio: This matchup pits the popular Shiller P/E against a more niche, specialized valuation metric. It’s a test of whether readers prefer earnings-based valuation versus specific technical calculation.
#4 Q-Ratio vs. #5 S&P 500 Regression to Trendline: A technical fundamental metric (replacement cost) meets a long-term mathematical trend line. This matchup determines if readers prefer a single “clean” metric or a price-history-based regression.
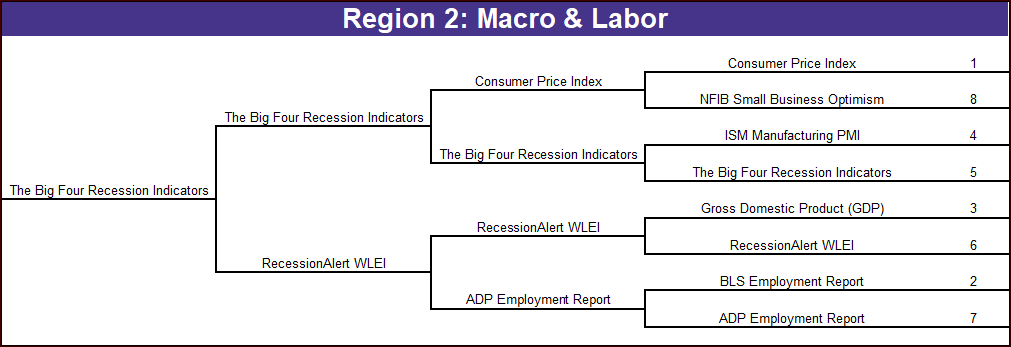
Region 2: Macro & Labor
This region features the traditional high-impact economic indicators that garner a lot of media attention and typically influence the Federal Reserve’s decisions.
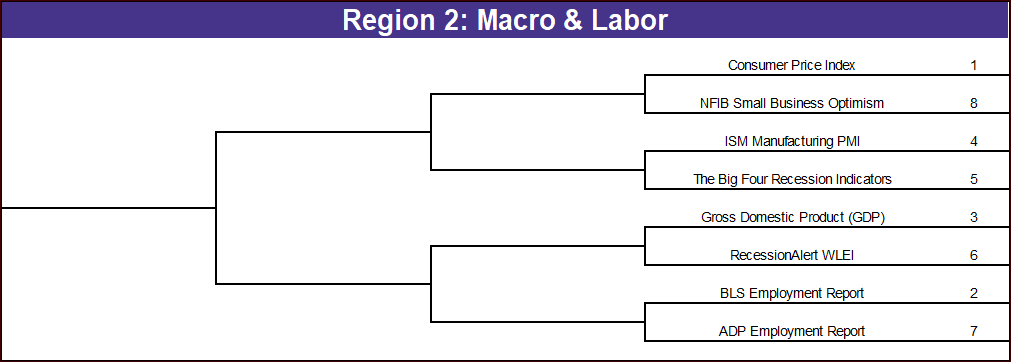
#1 Consumer Price Index vs. #8 NFIB Small Business Optimism: The defining story of the last few years (inflation) faces off against the “boots on the ground” sentiment of small business owners.
#2 BLS Employment Report vs. #7 ADP Employment Report: The “official” government numbers versus the private sector’s early look. Readers traditionally use one to predict the other, making this a classic head-to-head rivalry.
#3 Gross Domestic Product vs. #6 RecessionAlert WLEI: The ultimate lagging indicator (GDP) meets a forward-looking predictive model. This matchup reveals if readers are looking at where we’ve been or where we are going.
#4 ISM Manufacturing PMI vs. #5 The Big Four Recession Indicators: The primary indicator for industrial health meets a top-tier aggregate of government data.
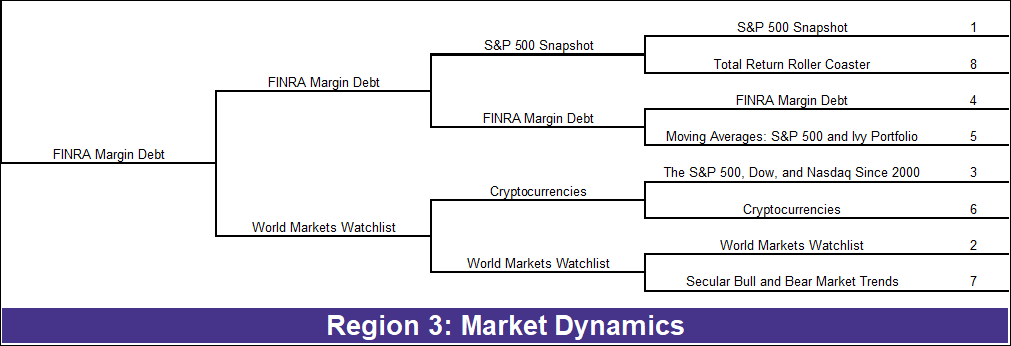
Region 3: Market Dynamics
This region captures the “Pulse” of the market, focusing on technical health, leverage, and weekly updates that keep readers engaged.
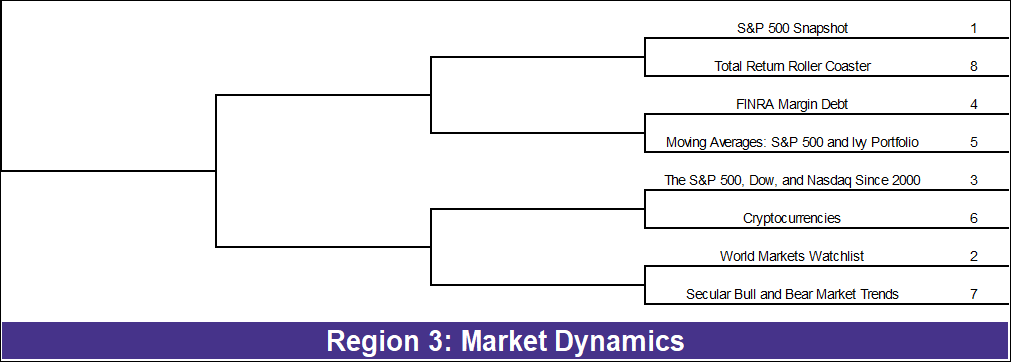
#1 S&P 500 Snapshot vs. #8 Total Return Roller Coaster: The broad market’s weekly recap faces a technical breakdown of historical volatility and total return cycles.
#2 World Markets Watchlist vs. #7 Secular Bull and Bear Market Trends: Global market breadth goes up against long-term cycle definitions. It’s a test of whether readers are looking outward at the world or inward at the current market cycle.
#3 The S&P 500, Dow, and Nasdaq Since 2000 vs. #6 Cryptocurrencies: Historical benchmark performance meets the ultimate “risk-on” asset.
#4 FINRA Margin Debt vs. #5 Moving Averages: S&P 500 and Ivy Portfolio: A critical measure of market leverage takes on a multi-asset technical strategy.
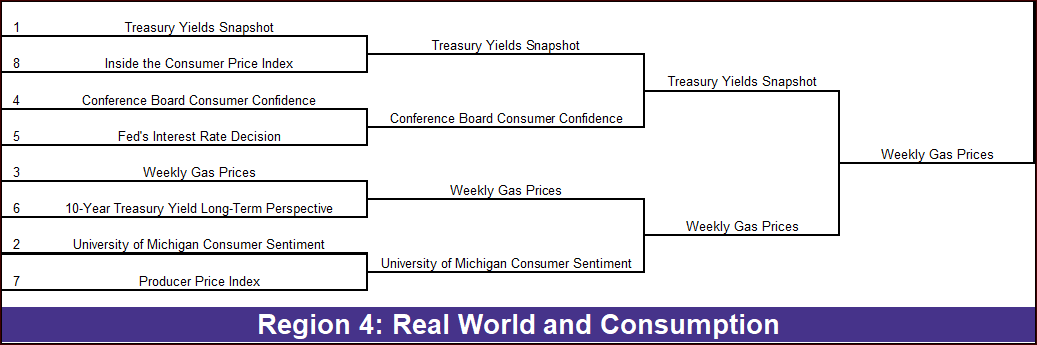
Region 4: Real-World & Consumption
This region is represented by the indicators that impact the average household’s wallet and daily life.
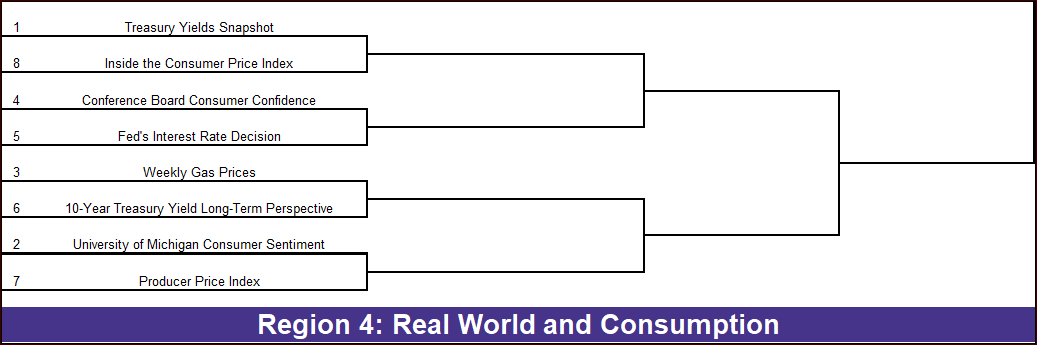
#1 Treasury Yields Snapshot vs. #8 Inside the Consumer Price Index: A technical look at the bond market versus the granular data of what people are actually paying for goods and services.
#2 University of Michigan Consumer Sentiment vs. #7 Producer Price Index: How people feel about the economy meets the “behind the scenes” cost of wholesale production.
#3 Weekly Gas Prices vs. #6 10-Year Treasury Yield Long-Term Perspective: The most visible sign of inflation, the gas pump, takes on a long-term look of the 10-year Treasury yield.
#4 Conference Board Consumer Confidence vs. #5 Fed’s Interest Rate Decision: A measure of consumer optimism faces off with the most powerful policy tool in the world.
The Final Four
After looking at the data, here’s how the bracket played out. The Final Four represented a perfect cross-section of the current investor psyche, featuring a mix of heavyweights and true “Cinderella stories”.
In Region 1, there were no surprises, with the top-seeds advancing in each round, reinforcing our readers’ core focus on long-term valuation.
In Region 2, we saw several upsets. While inflation (CPI) has dominated headlines, the #5 seed Big Four Recession Indicators captured more sustained engagement, suggesting that recession fears outweigh price concerns.
In Region 3, the ultimate Cinderella story of the tournament. The #4 seed FINRA Margin Debt beat out more traditional market recaps, showing that readers are highly attuned to the risks of market leverage.
In Region 4, a classic #3 seed run. Gas Prices outpaced high-level policy data and consumer attitude reports, proving that pocketbook issues remain one of the most consistent drivers of reader interest.
The Champion
While “Main Street” data like gas prices and technical wildcards like Margin Debt saw massive surges in interest over the past year, the overall winner is our deep dive into market valuation. This result confirms that despite the headlines seen across various outlets, our readers are consistently most engaged with the fundamental question: Is the market still overvalued?
Originally published on Advisor Perspectives
For more news, information, and strategy, visit the Fixed Income Content Hub.
