



This weekly update tracks some of the largest cryptocurrencies by market share: Bitcoin and Ether. While both are considered high-risk assets, they possess foundational differences that investors should understand. We have also included XRP, as it was one of the largest cryptocurrencies when this series began. By definition, a cryptocurrency is a digital asset designed to work as a medium of exchange that uses cryptography to secure its transactions, control the creation of additional units, and verify the transfer of assets.
Key Takeaways
- Bitcoin bounced back above $60,000 this week
- Ether rallied to its highest level in over a month this week.
- Bitcoin is down approximately 28% year-to-date, while Ether has fallen roughly 40% year-to-date.
Bitcoin
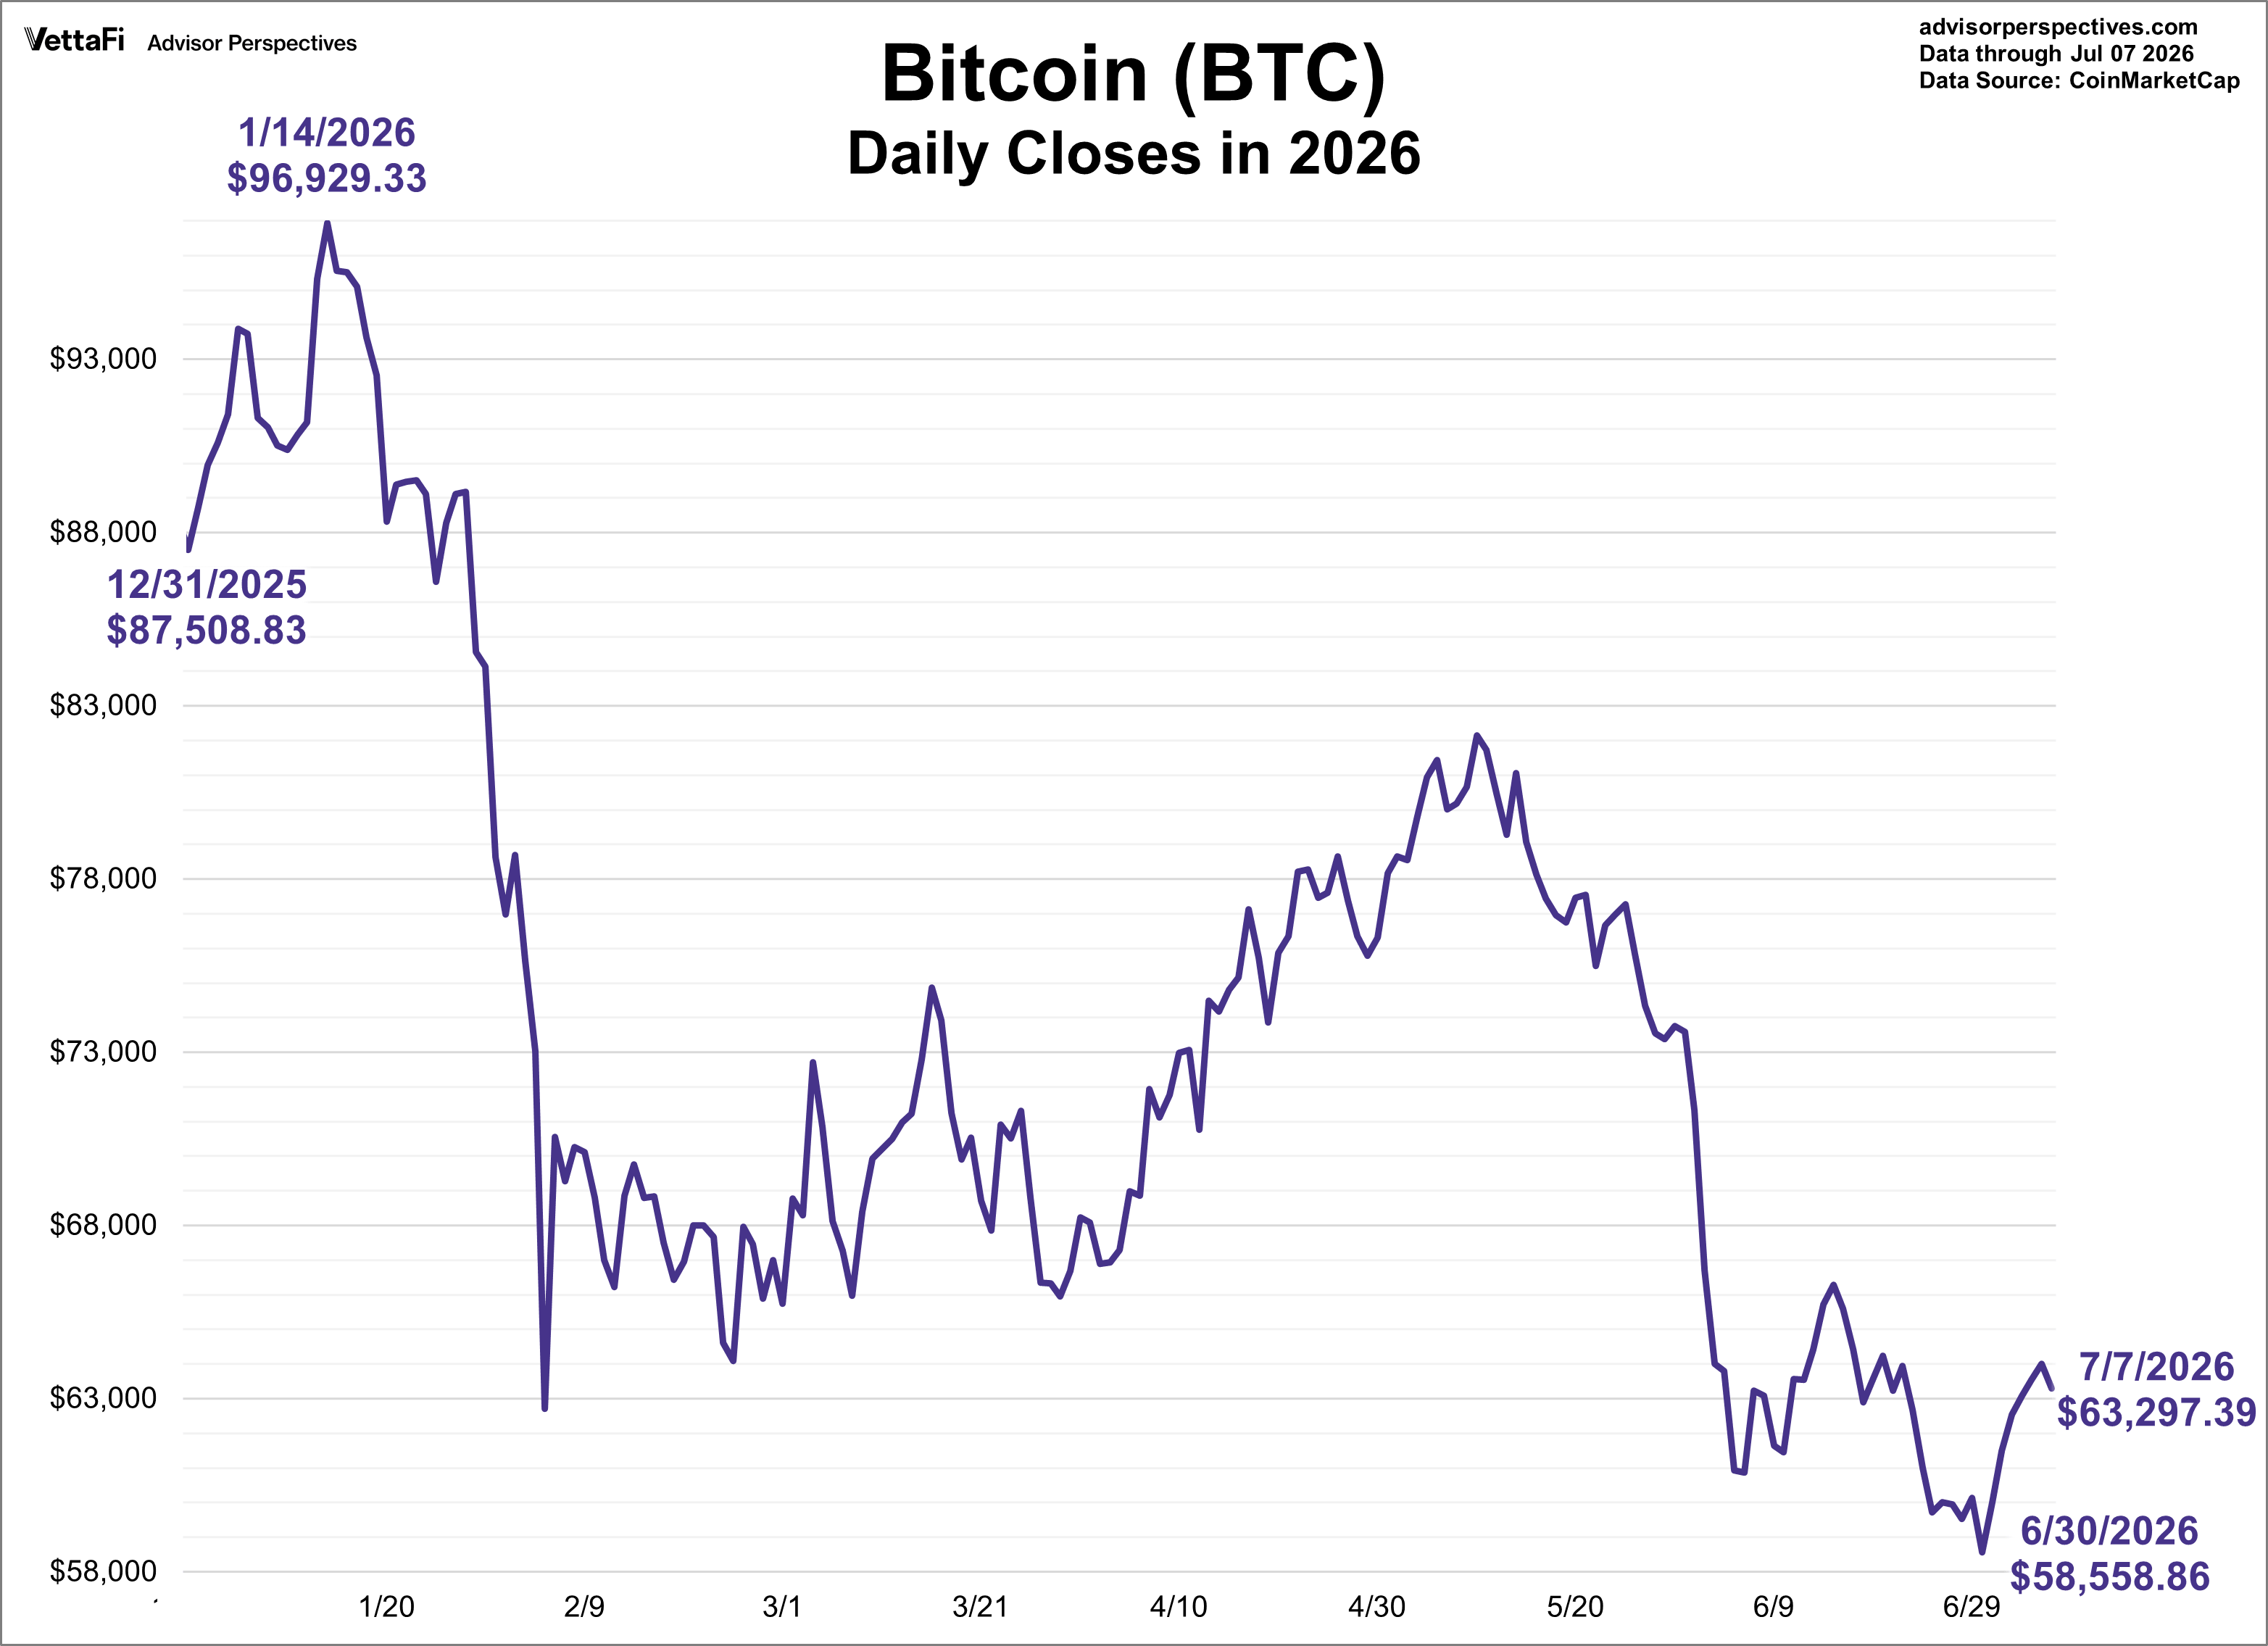
Bitcoin was the world’s first decentralized digital currency. Since the first Bitcoin transaction occurred in early 2009, it has grown worldwide to a mainstream financial asset. While often volatile, as illustrated in the chart below, one can argue that the Bitcoin is highly resilient, especially as product innovation expands the ways investors can manage Bitcoin’s volatility.
Bitcoin’s closing price rebounded this week, rising over 8% to move back above $60,000. However, BTC is currently down approximately 28% year-to-date and sits about 49% below its October 2025 record high. Learn more about Bitcoin basics for new investors.
Ether
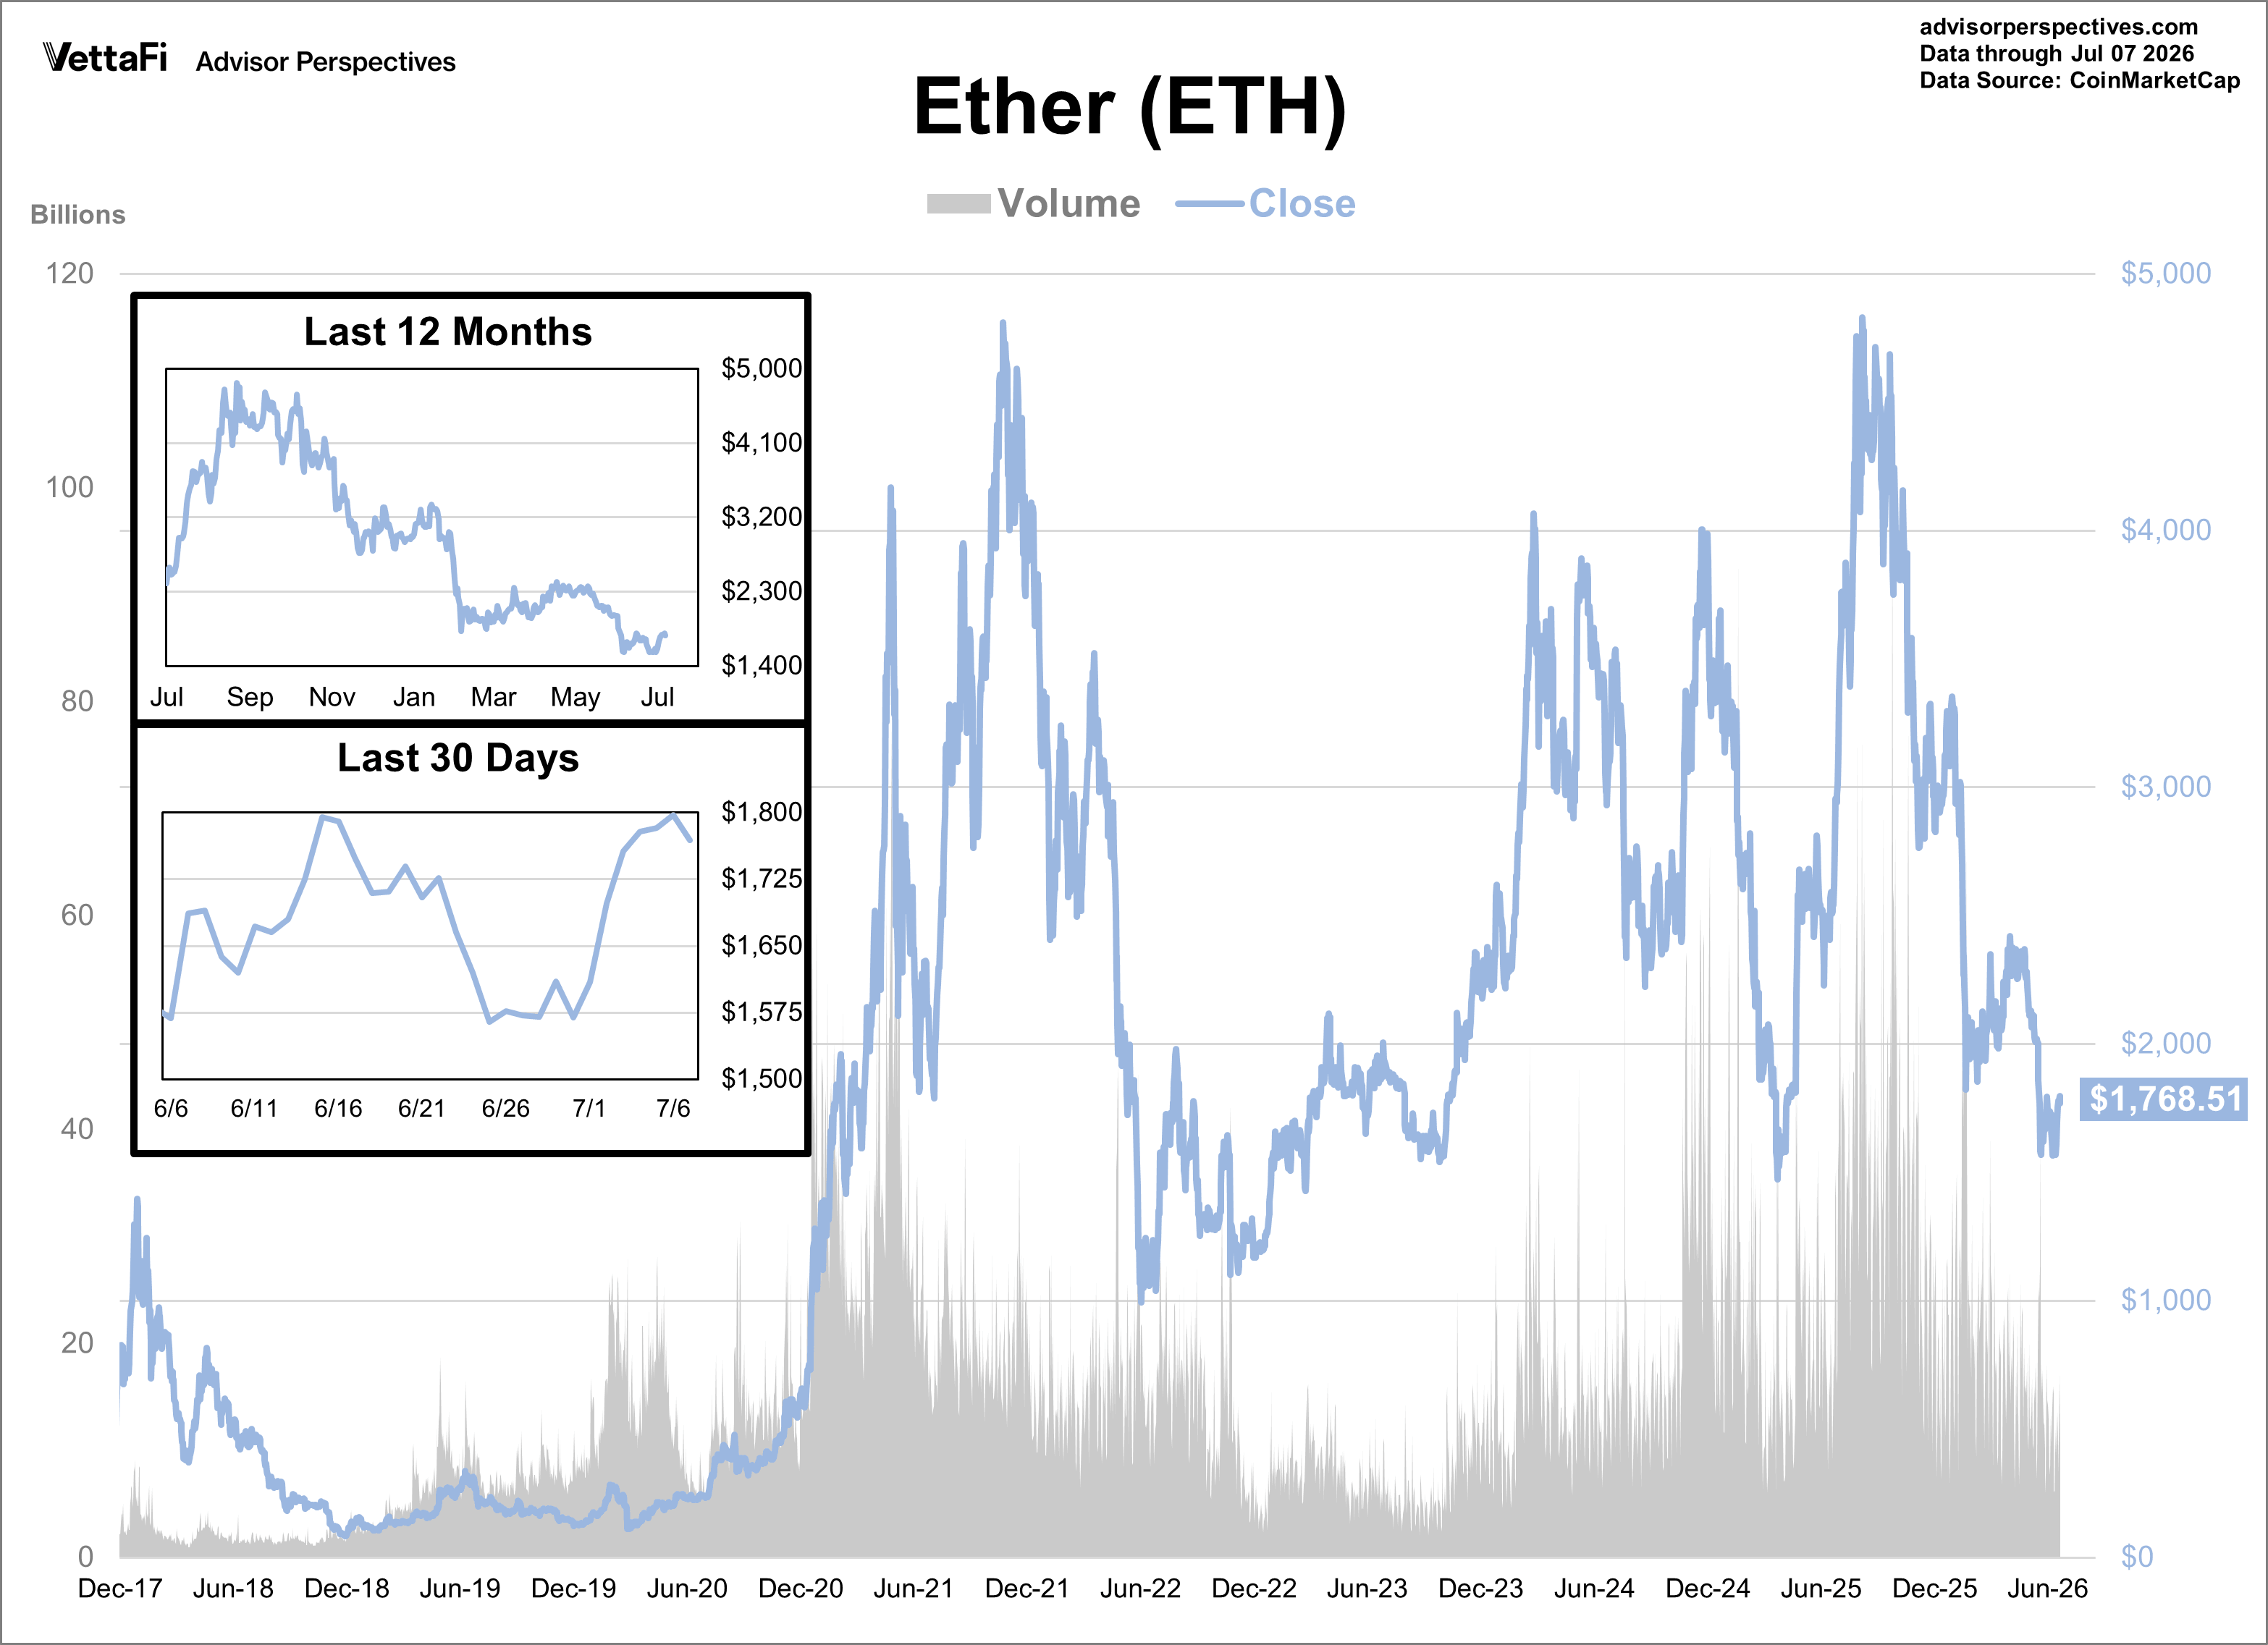
Ether is the native cryptocurrency run on the Ethereum blockchain platform, which launched in July 2015. It has the second largest market share, despite being the newest of the three assets discussed in this article.
Ether’s closing price also rallied this past week, climbing nearly 13% to its highest level in over a month. With that said, ETH is currently down approximately 40% year-to-date and is now roughly 63% below its record close from August 2025.
XRP
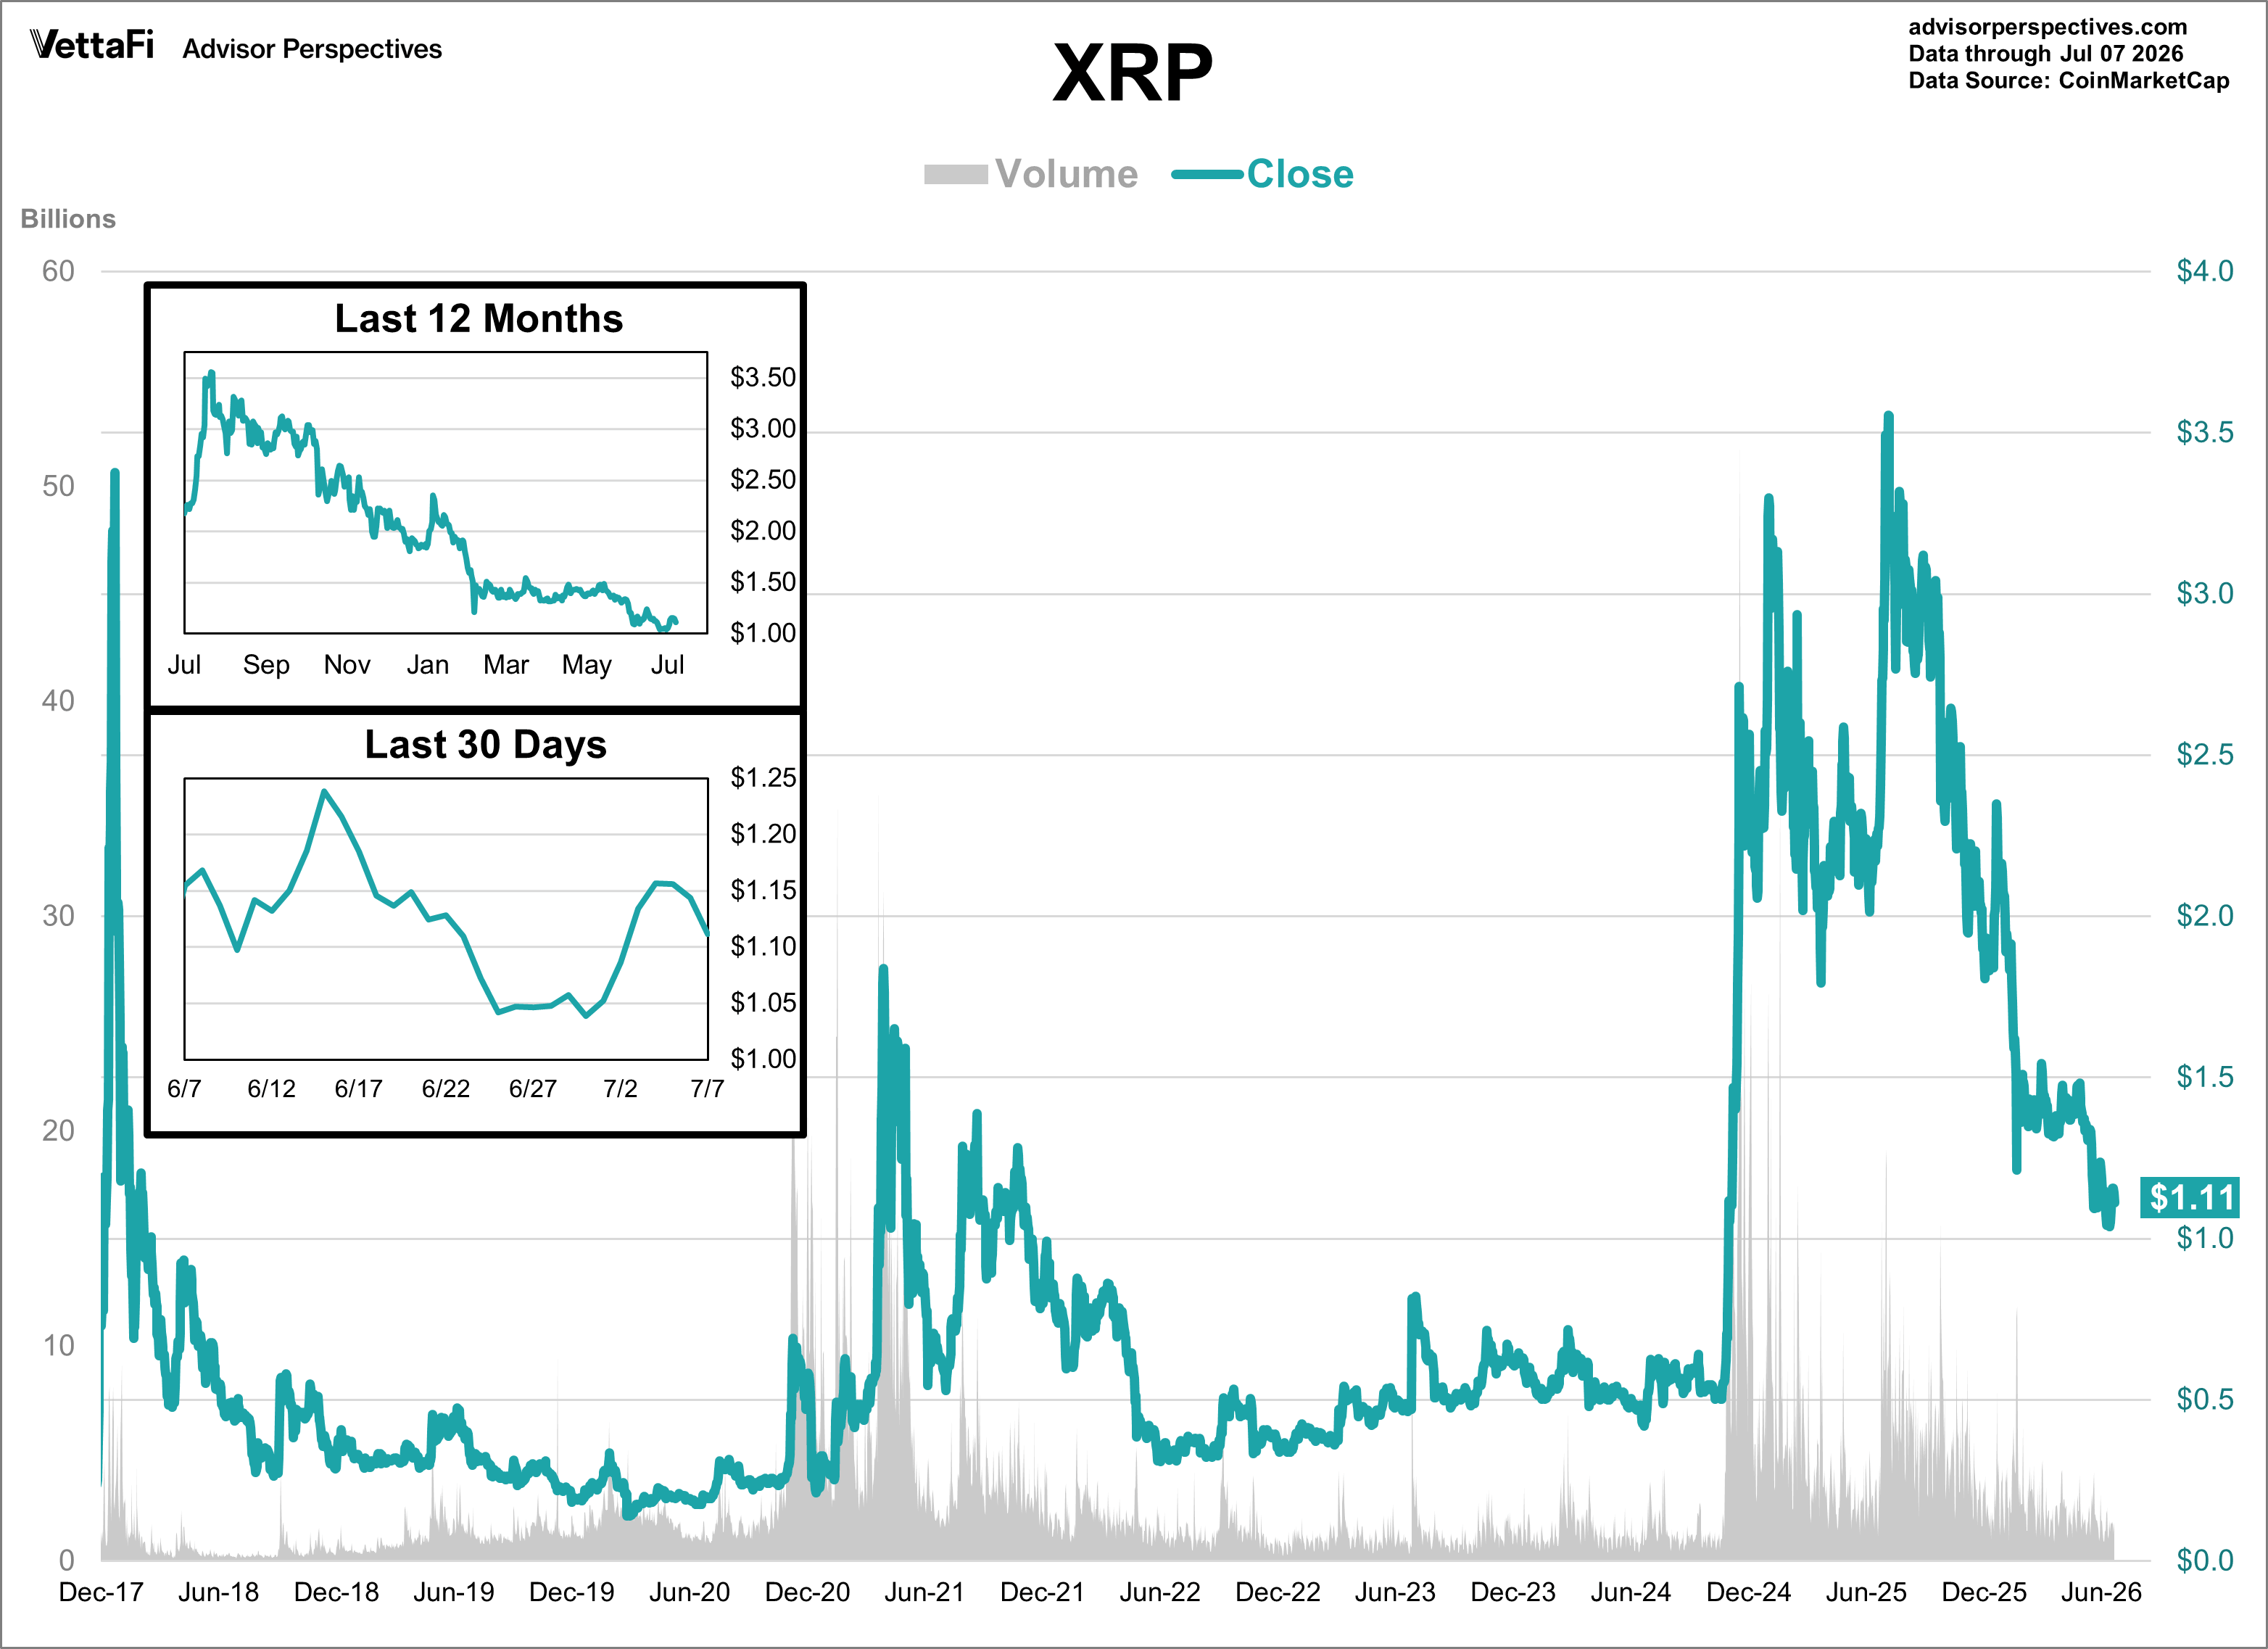
XRP, which is owned by Ripple, was launched in 2012 and was one of the larger cryptocurrencies for some time until newer tokens entered the market.
Bitcoin vs. Ether vs. XRP
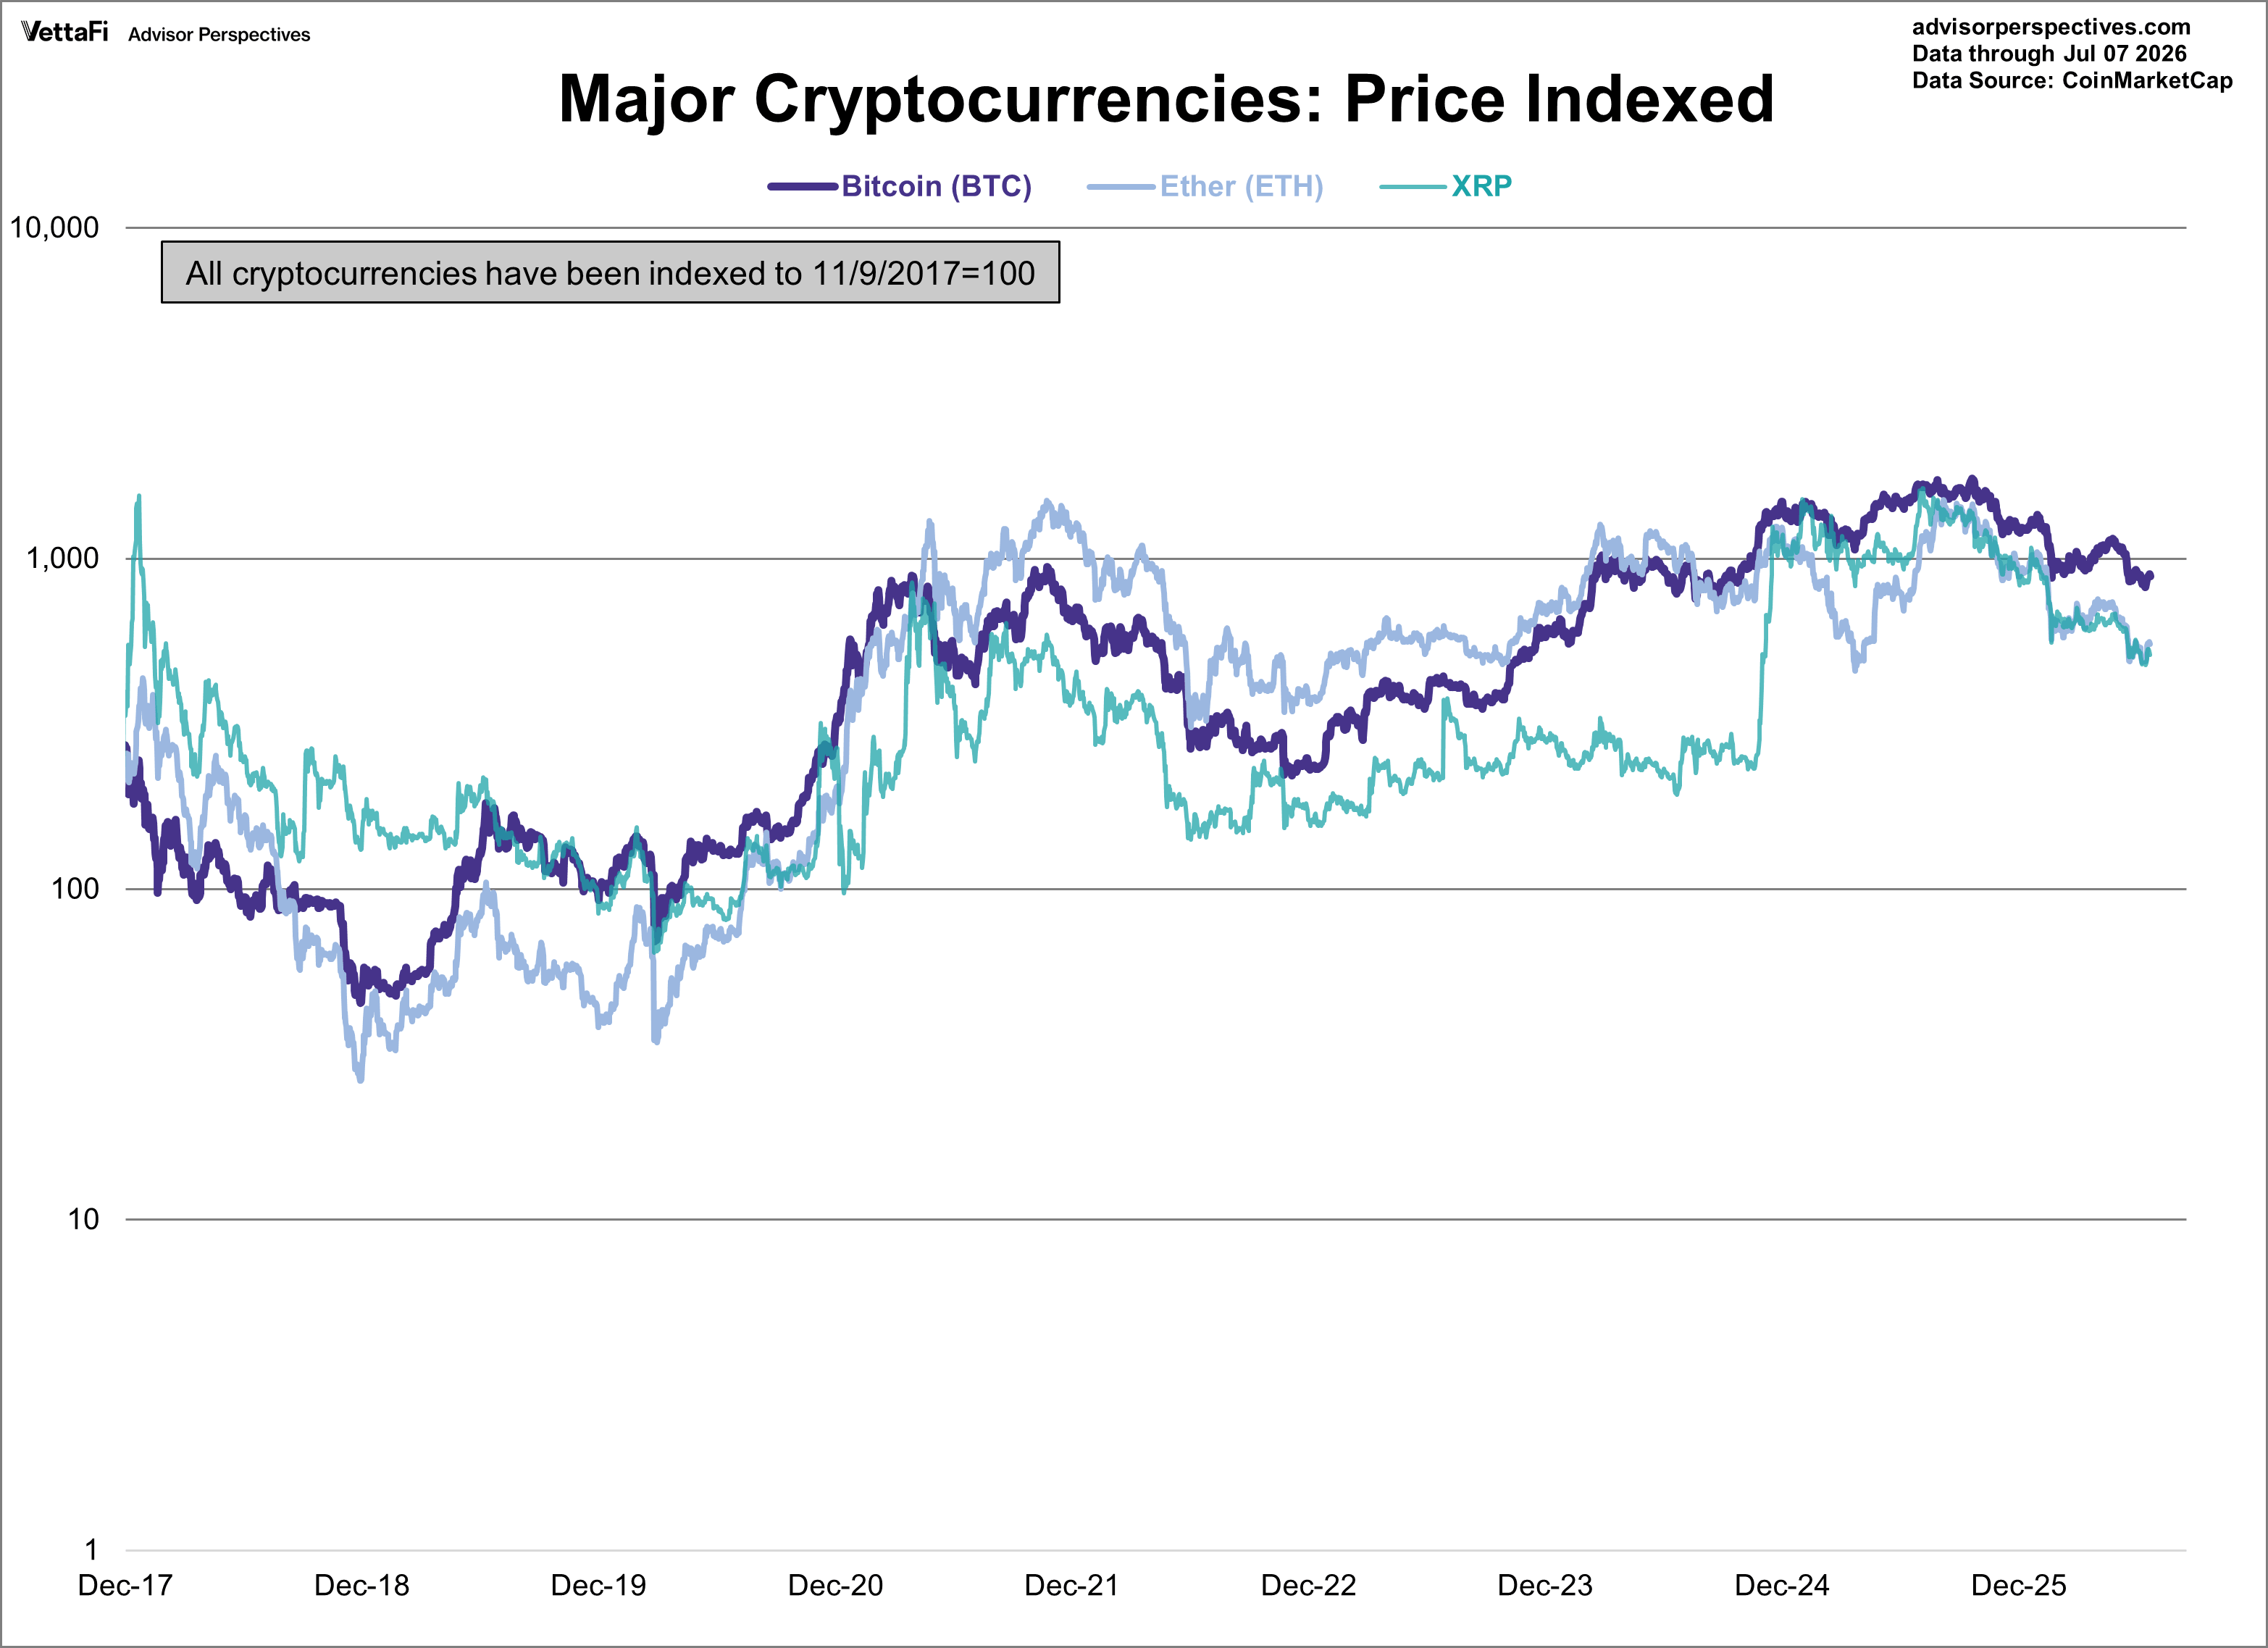
An index has been created in order to chart these three cryptocurrencies together, considering their significantly different pricing histories. A logarithmic scale is used on the y-axis of this chart to better illustrate relative percentage changes and long-term growth trends, as opposed to absolute price fluctuations. The chart demonstrates which cryptocurrency’s price has shifted the most since November 9, 2017. At various points in history, all three have held the top spot but Bitcoin is currently in the lead.
On January 10th, 2024, the SEC approved spot bitcoin ETFs from a range of issuers such as Grayscale Bitcoin Trust ETF (GBTC), iShares Bitcoin Trust (IBIT), Fidelity Wise Origin Bitcoin Fund (FBTC), ARK 21Shares Bitcoin ETF (ARKB), Bitwise Bitcoin ETF (BITB), Coinshares Valkyrie Bitcoin Fund (BRRR). Review our spot Bitcoin ETF launch takeaways for a complete breakdown.
On July 23rd, 2024, a handful of spot ether ETFs launched from a range of issuers such as Grayscale Ethereum Trust (ETHE), Franklin Ethereum ETF (EZET), Bitwise Ethereum ETF (ETHW), iShares Ethereum Trust (ETHA), Fidelity Ethereum ETF (FETH). For a deep dive, see our spot Ether ETF guide.
Originally published on Advisor Perspectives.
For more news, information, and analysis, visit the Cryptocurrency Content Hub.