
The energy infrastructure sector includes a range of different business models, from gathering systems at the wellhead to long-haul pipelines and export facilities. Comparing midstream companies without a standardized framework of midstream classifications can be difficult. With all the varying contract structures, growth drivers, and risks inherent in each of these businesses, it’s important for investors to understand this framework as well. Learn more below about how the Energy MLP Classification Standard (EMCS) solves this by organizing companies into clear subsectors, how these categories shape major midstream benchmarks, and what factors are driving valuations and year-to-date performance across the space today.
Key Takeaways
- The Energy MLP Classification Standard (EMCS) categorizes energy infrastructure companies based on their primary source of cash flows. This provided an essential framework to accurately benchmark indexes, compare peer groups, and analyze relative performance.
- Applying the EMCS framework to midstream benchmarks highlights the differences between broad midstream indexes and MLP-only indexes, particularly regarding their weightings toward natural gas infrastructure.
- Forward EV/EBITDA multiples and total returns vary by subsector based on contract visibility, customer quality, and commodity exposure.
The Mechanics of Midstream Classification
The Energy MLP Classification Standard (EMCS) is the framework used to standardize the business activities of companies within the Alerian midstream index suite.
Before its introduction a decade ago, investors lacked a unified benchmark for attribution analysis. Research analysts frequently disagreed on categorizations. Without a standardized framework, stakeholders often resorted to a vague “diversified” label for highly integrated companies. By establishing a unified benchmark, the EMCS enabled investors to better analyze relative performance by subsector.
In the EMCS, energy infrastructure companies are categorized by their primary business activity, based on what generates the majority of cash flow on a trailing-four-quarter basis. Classifications are determined using a variety of publicly available resources. This included SEC filings, press releases, and investor presentations. The classifications and their definitions are included below:
By having one standardized classification, energy infrastructure companies have a more objective way of determining their peer group. Companies are assigned to a single classification, even if their revenues are relatively evenly split across multiple business lines. There is no “diversified” category by design. It wouldn’t make sense to compare a highly defensive, long-haul pipeline operator to a commodity-sensitive gathering and processing company.
Interpreting Index Weightings Using EMCS Subsectors
Within the Alerian suite, two broad benchmarks are frequently used to delineate and analyze the midstream sector across C-Corps and Master Limited Partnerships (MLPs). The Alerian Midstream Energy Corporation Index (AMCC) represents North American energy infrastructure corporations, while the Alerian MLP Index (AMZ) serves as the leading gauge of energy infrastructure MLPs. As of June 26, AMZ was yielding 6.7%, and AMCC was yielding 3.5%.
Structurally, midstream C-Corps tend to have a larger footprint in natural gas infrastructure compared to their MLP counterparts. When analyzing these weightings, it is also important to note that marketing and distribution, as well as compression, are not qualifying activities for AMCC.
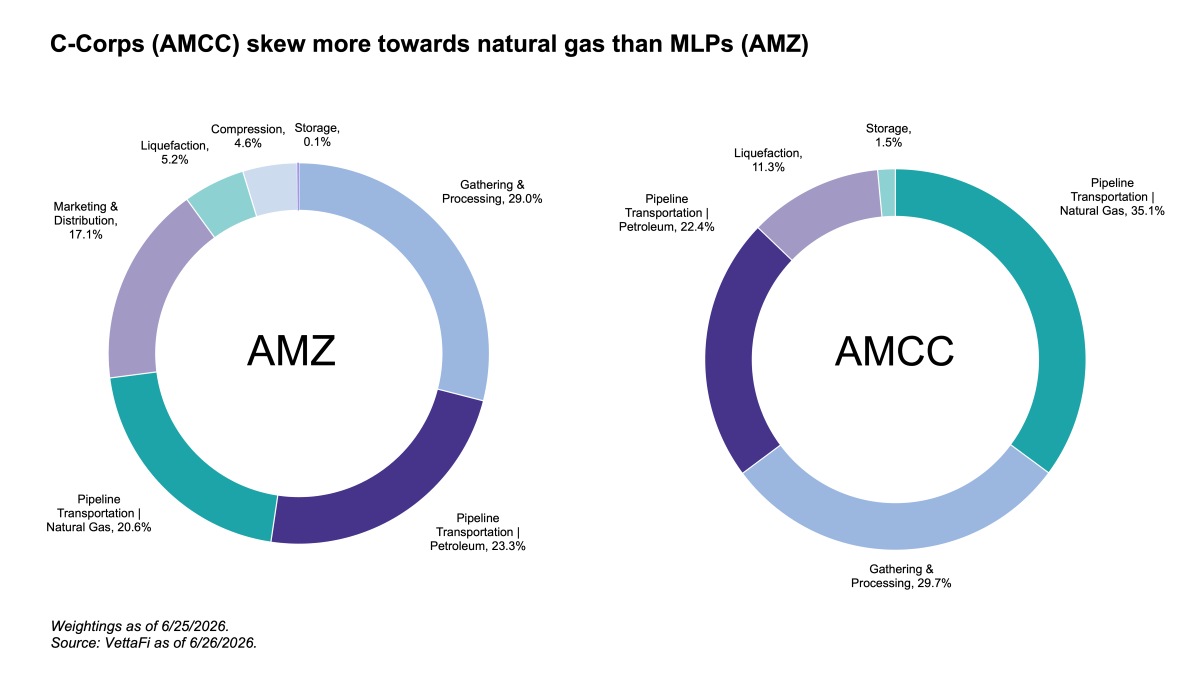
As shown above, AMCC skews significantly more towards subsectors primarily focused on natural gas. This include the natural gas pipeline transportation, gathering & processing, and liquefaction subsectors. As of June 26, over three-fourths of AMCC by weight was dedicated to natural gas infrastructure, whereas roughly half of AMZ by weight focuses on natural gas.
Comparing Subsector Multiples in the Midstream Space
Broadly, C-Corps tend to command higher valuations than MLPs. This is due to a combination of factors such as simplified tax reporting without K-1s, more traditional corporate governance, and eligibility for inclusion in broad market equity indexes. For instance, four midstream C-Corps collectively constitute roughly 0.4% of the S&P 500 by weight: Kinder Morgan (KMI), ONEOK (OKE), Targa Resources (TRGP), and Williams (WMB).
Overall, on a weighted average basis, AMCC is trading at 11.94x 2027 EBITDA as of June 25, while AMZ is trading at 8.89x 2027 EBITDA. While corporate structure clearly impacts valuations, the underlying business is also important in determining multiples. In general, investors will pay a premium for longer-term cash flow visibility. Looking at the broader Alerian Midstream Energy Index (AMNA), which is trading at 11.56x 2027 EBITDA overall, subsectors exhibit a clear variance in valuation. The subsector multiples below are simple averages and track lower than the overall AMNA index because the largest constituents command higher valuations.
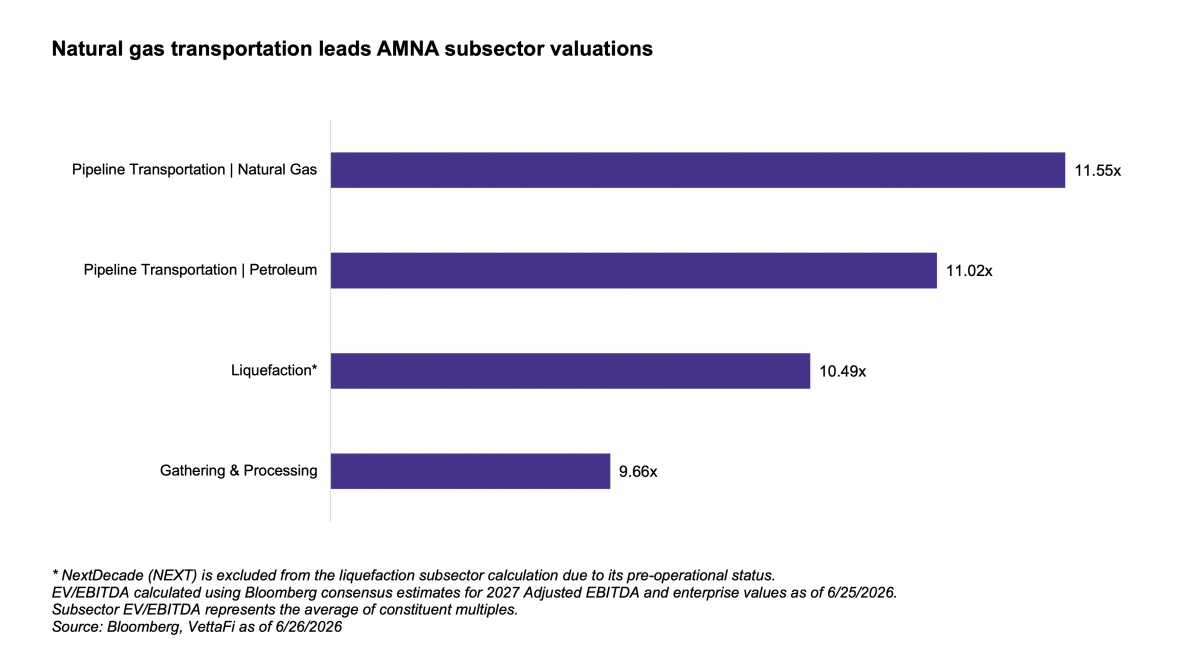 Long-haul pipeline transportation, both petroleum and natural gas, commands higher multiples alongside liquefaction. This is because long-haul pipelines are typically backed by investment-grade counterparties and sticky, long-term, fee-based contracts. This business model provides stronger cash flow certainty and longer visibility, which justifies higher EBITDA multiples.
Liquefaction vs. Gathering & Processing Contracts
Liquefaction names also tend to have higher forward multiples. This is driven primarily by their long-term revenue visibility, often backed by 20-year sales agreements, and their ability to generate substantial cash flow once operational. Currently, these companies are building out liquefied natural gas (LNG) export capacity to meet global natural gas demand. By 2031, U.S. LNG export capacity is set to roughly double, an increase of 18.7 billion cubic feet per day (Bcf/d). More broadly, this buildout has been a key tailwind for natural-gas-focused names in the midstream space alongside rising power needs, including from data centers, that could drive an incremental 9.9 Bcf/d of U.S. natural gas demand to 2030. For reference, U.S. natural gas demand was 92.0 Bcf/d in 2025.
With this expected natural gas demand growth, the slew of expansion projects underway are largely for demand-pull natural gas pipelines. These tend to command higher premiums due to longer contract terms and stronger customers. Notably, growth projects span the U.S., instead of being concentrated in Texas. Natural gas pipelines tend to be more utility-like, which can also support stronger valuations.
Conversely, gathering and processing (G&P) assets tend to command some of the lowest EBITDA multiples in the sector. These smaller pipelines move hydrocarbons away from the wellhead, and are thus highly dependent on localized producer output, face greater regional competition, and typically operate on much shorter-term contracts. Furthermore, G&P operators frequently rely on acreage dedications. These are usually lower quality contracts that only promise the output of a specific area, rather than minimum volume commitments. This inherent volume risk and greater commodity exposure results in a valuation discount compared to other subsectors.
Gathering & Processing Leads AMNA Subsectors in YTD Performance
The macroeconomic narrative in 2026 has been dominated by the conflict with Iran and the closure of the Strait of Hormuz. While broader equity markets experienced heightened volatility, energy has been a clear standout, and AMNA has generated a robust total return of 25.9% through June 26. Entering the year, there were some concerns in the energy sector about U.S. production growth slowing down this year and in 2027. However, with West Texas Intermediate (WTI) crude up 20.6% year-to-date through June 26 and the crude futures curve at a supportive level, those fears have evaporated. The U.S. Energy Information Administration (EIA) now expects U.S. oil production to reach a new record high in 2027, reversing prior expectations for a decline. The improved volume outlook and strong free cash flow generation have driven robust performance across the midstream space.
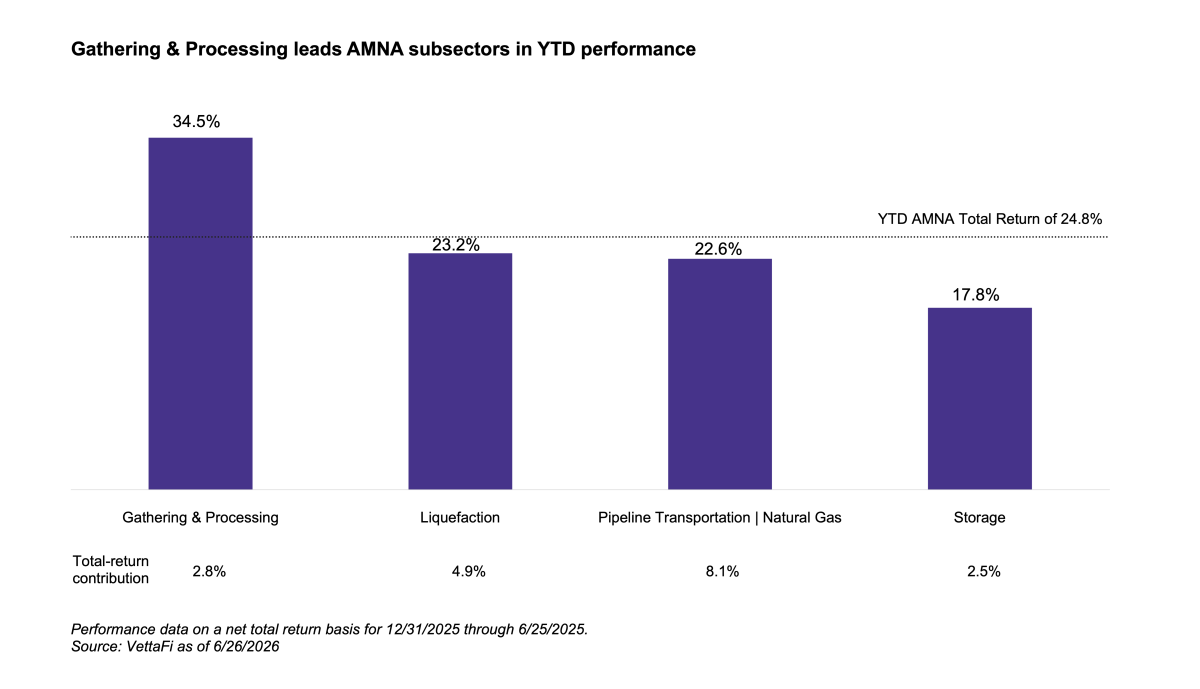 As shown above, the gathering & processing (G&P) subsector has clearly stood out, handily outperforming AMNA’s year-to-date total return. Due to their proximity to the wellhead, shorter contract lengths, and fee structures that can include a portion of commodity prices, G&P operators tend to be more commodity-sensitive than long-haul pipelines. In a rising commodity price environment, this allows them to capture more immediate upside.
Other Strong Performance Factors in 2026
Liquefaction names also posted strong returns, stemming from Middle East supply shocks, specifically the closure of the Strait of Hormuz and strikes that reportedly took about 17% of Qatar’s LNG export capacity offline for an estimated 3-5 years. U.S. LNG exporters with the flexibility to sell spot cargoes into this higher-priced international market have been the primary beneficiaries. For example, Venture Global (VG), which was only 69% contracted as of February, is up 60.6% on a total-return year-to-date through June 26. Cheniere Energy (LNG), though heavily contracted at over 90%, has also benefited significantly, returning 24.3% over the same period.
Meanwhile, natural gas and petroleum pipelines have benefited from the resulting long-term demand-pull and a resilient oil price backdrop, though trailing the broader index. Still, due to its heavier weighting relative to other subsectors, natural gas transportation contributed the most to AMNA’s overall performance year-to-date.
Bottom Line
As the energy sector evolves, the EMCS framework makes it easier to understand the midstream space by providing essential context. By grouping similar companies together, investors can accurately compare indexes and better analyze performance drivers.
Looking for midstream insights in your inbox? Subscribe here to keep a pulse on midstream investing through our weekly updates.
For more news, information, and analysis, visit the Energy Infrastructure Content Hub
Related Research:
U.S. Oil Production Outlook & Midstream Implications
Is Oil’s Peak Behind Us? Does It Matter for Midstream?
Natural Gas, Demand-Pull Pipelines & Midstream Valuations
Surging U.S. Power Needs Drive Gas Infrastructure Opportunity
U.S. LNG Exports Surge Despite 4Q25 Headwinds
MLP 101: Addressing Common Investor Questions
Energy MLP Classification Standard
AMZ is the underlying index for the JPMCFC Alerian MLP Index ETN (AMJB), the ETRACS Alerian MLP Index ETN Series B (AMUB), and the ETRACS Quarterly Pay 1.5x Leveraged Alerian MLP Index ETN (MLPR).
vettafi.com is owned by VettaFi LLC (“VettaFi”). VettaFi is the index provider for AMJB, AMUB, and MLPR, for which it receives an index licensing fee. However, AMJB, AMUB, and MLPR are not issued, sponsored, endorsed, or sold by VettaFi. VettaFi has no obligation or liability in connection with the issuance, administration, marketing, or trading of AMJB, AMUB, and MLPR.
