
The U.S. economy showed a mix of resilience and policy friction as April concluded. While the Federal Reserve maintained current interest rates amidst historically high internal dissent, persistent inflation fueled by resurgent energy costs continues to challenge the path toward easing. Despite these pressures, the economy saw a notable acceleration in first-quarter growth and a marginal rise in consumer confidence, even as global instability shapes the outlook for the months ahead.
Federal Reserve Meeting
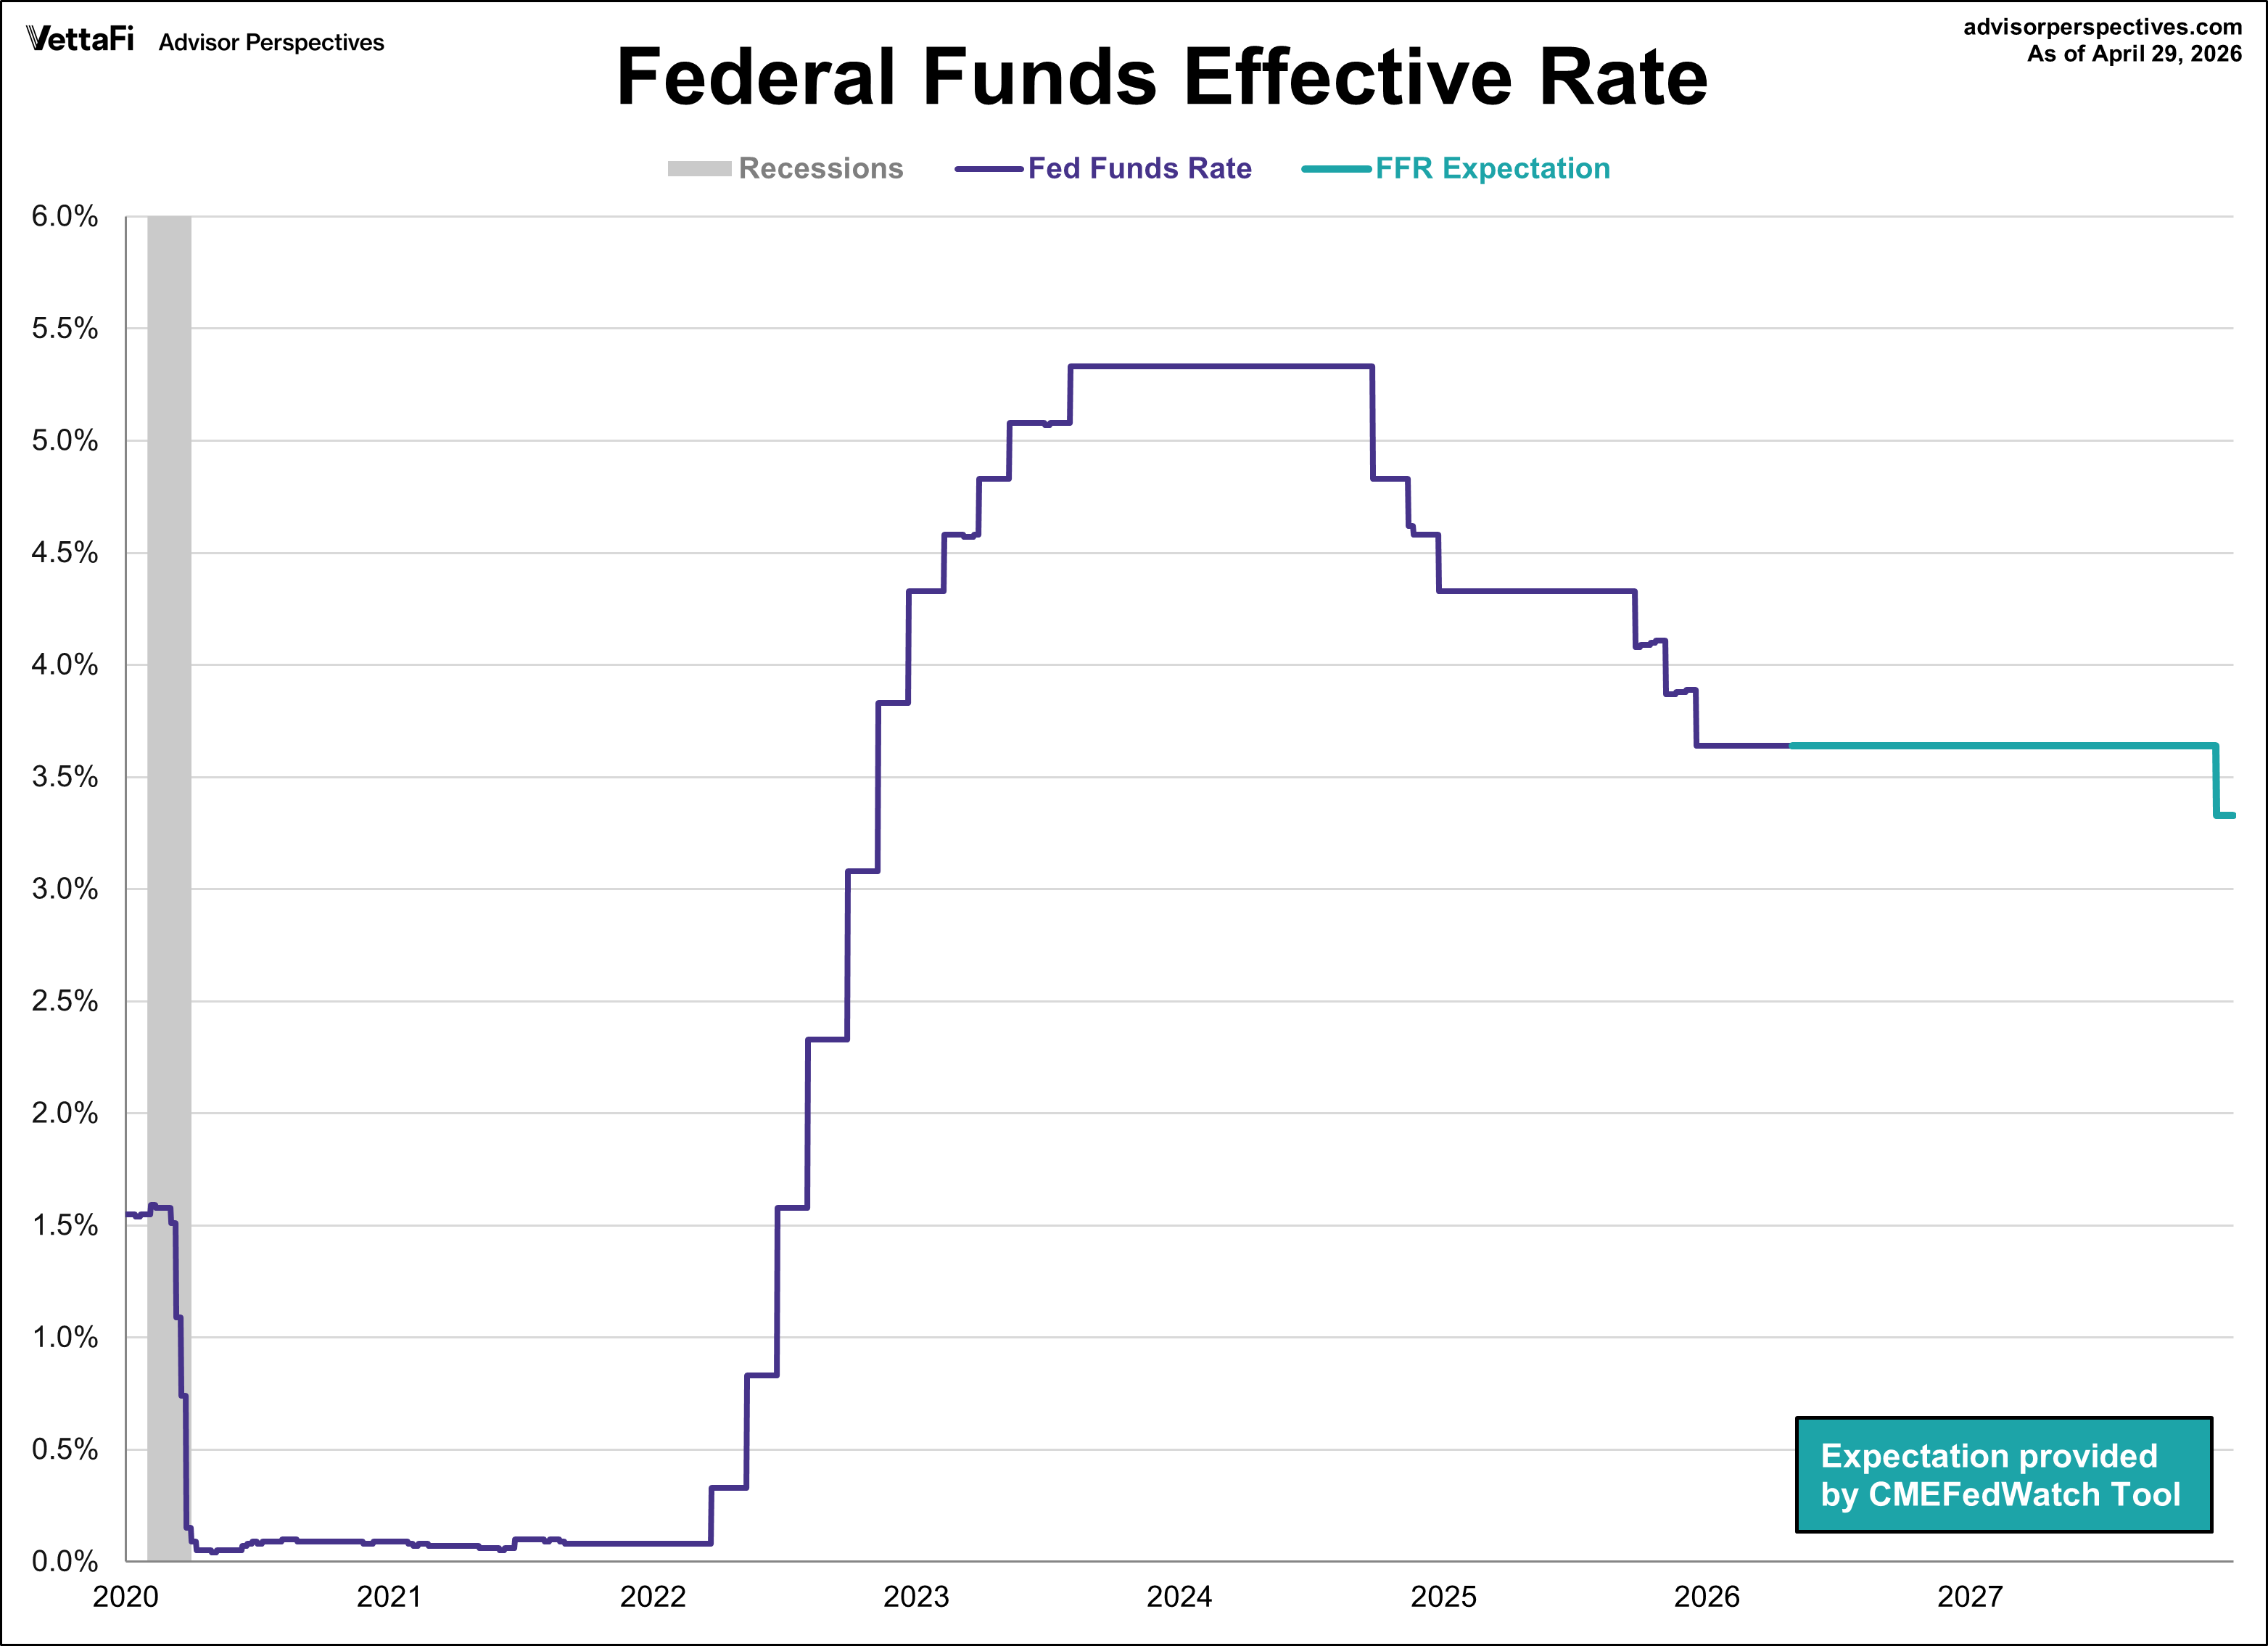
The Federal Reserve concluded its third meeting of the year by holding the federal funds rate in the range of 3.50%-3.75%. The decision, which markets had fully priced in prior to the meeting, keeps the benchmark rate at its lowest level since November 2022 for the third meeting in a row.
While the hold was expected, the Fed’s formal statement and a notable breakdown in voting captured the market’s attention. The Fed characterized inflation as “elevated,” specifically noting the effect of recent spikes in global energy costs. Perhaps the most striking aspect of the meeting was the exceptional level of disagreement among members, the highest since 1992. The dissent included one member voting for a 25 basis point cut and three members supporting the rate range but opposing the inclusion of an easing bias in the accompanying statement.
The CME FedWatch Tool currently indicates a 93% likelihood that the Fed will hold rates steady at their next meeting in June, compared to a 9% likelihood of a 25 basis point cut. Markets are currently projecting no rate movements for 2026 and one 25 basis point cut in October 2027.
Inflation
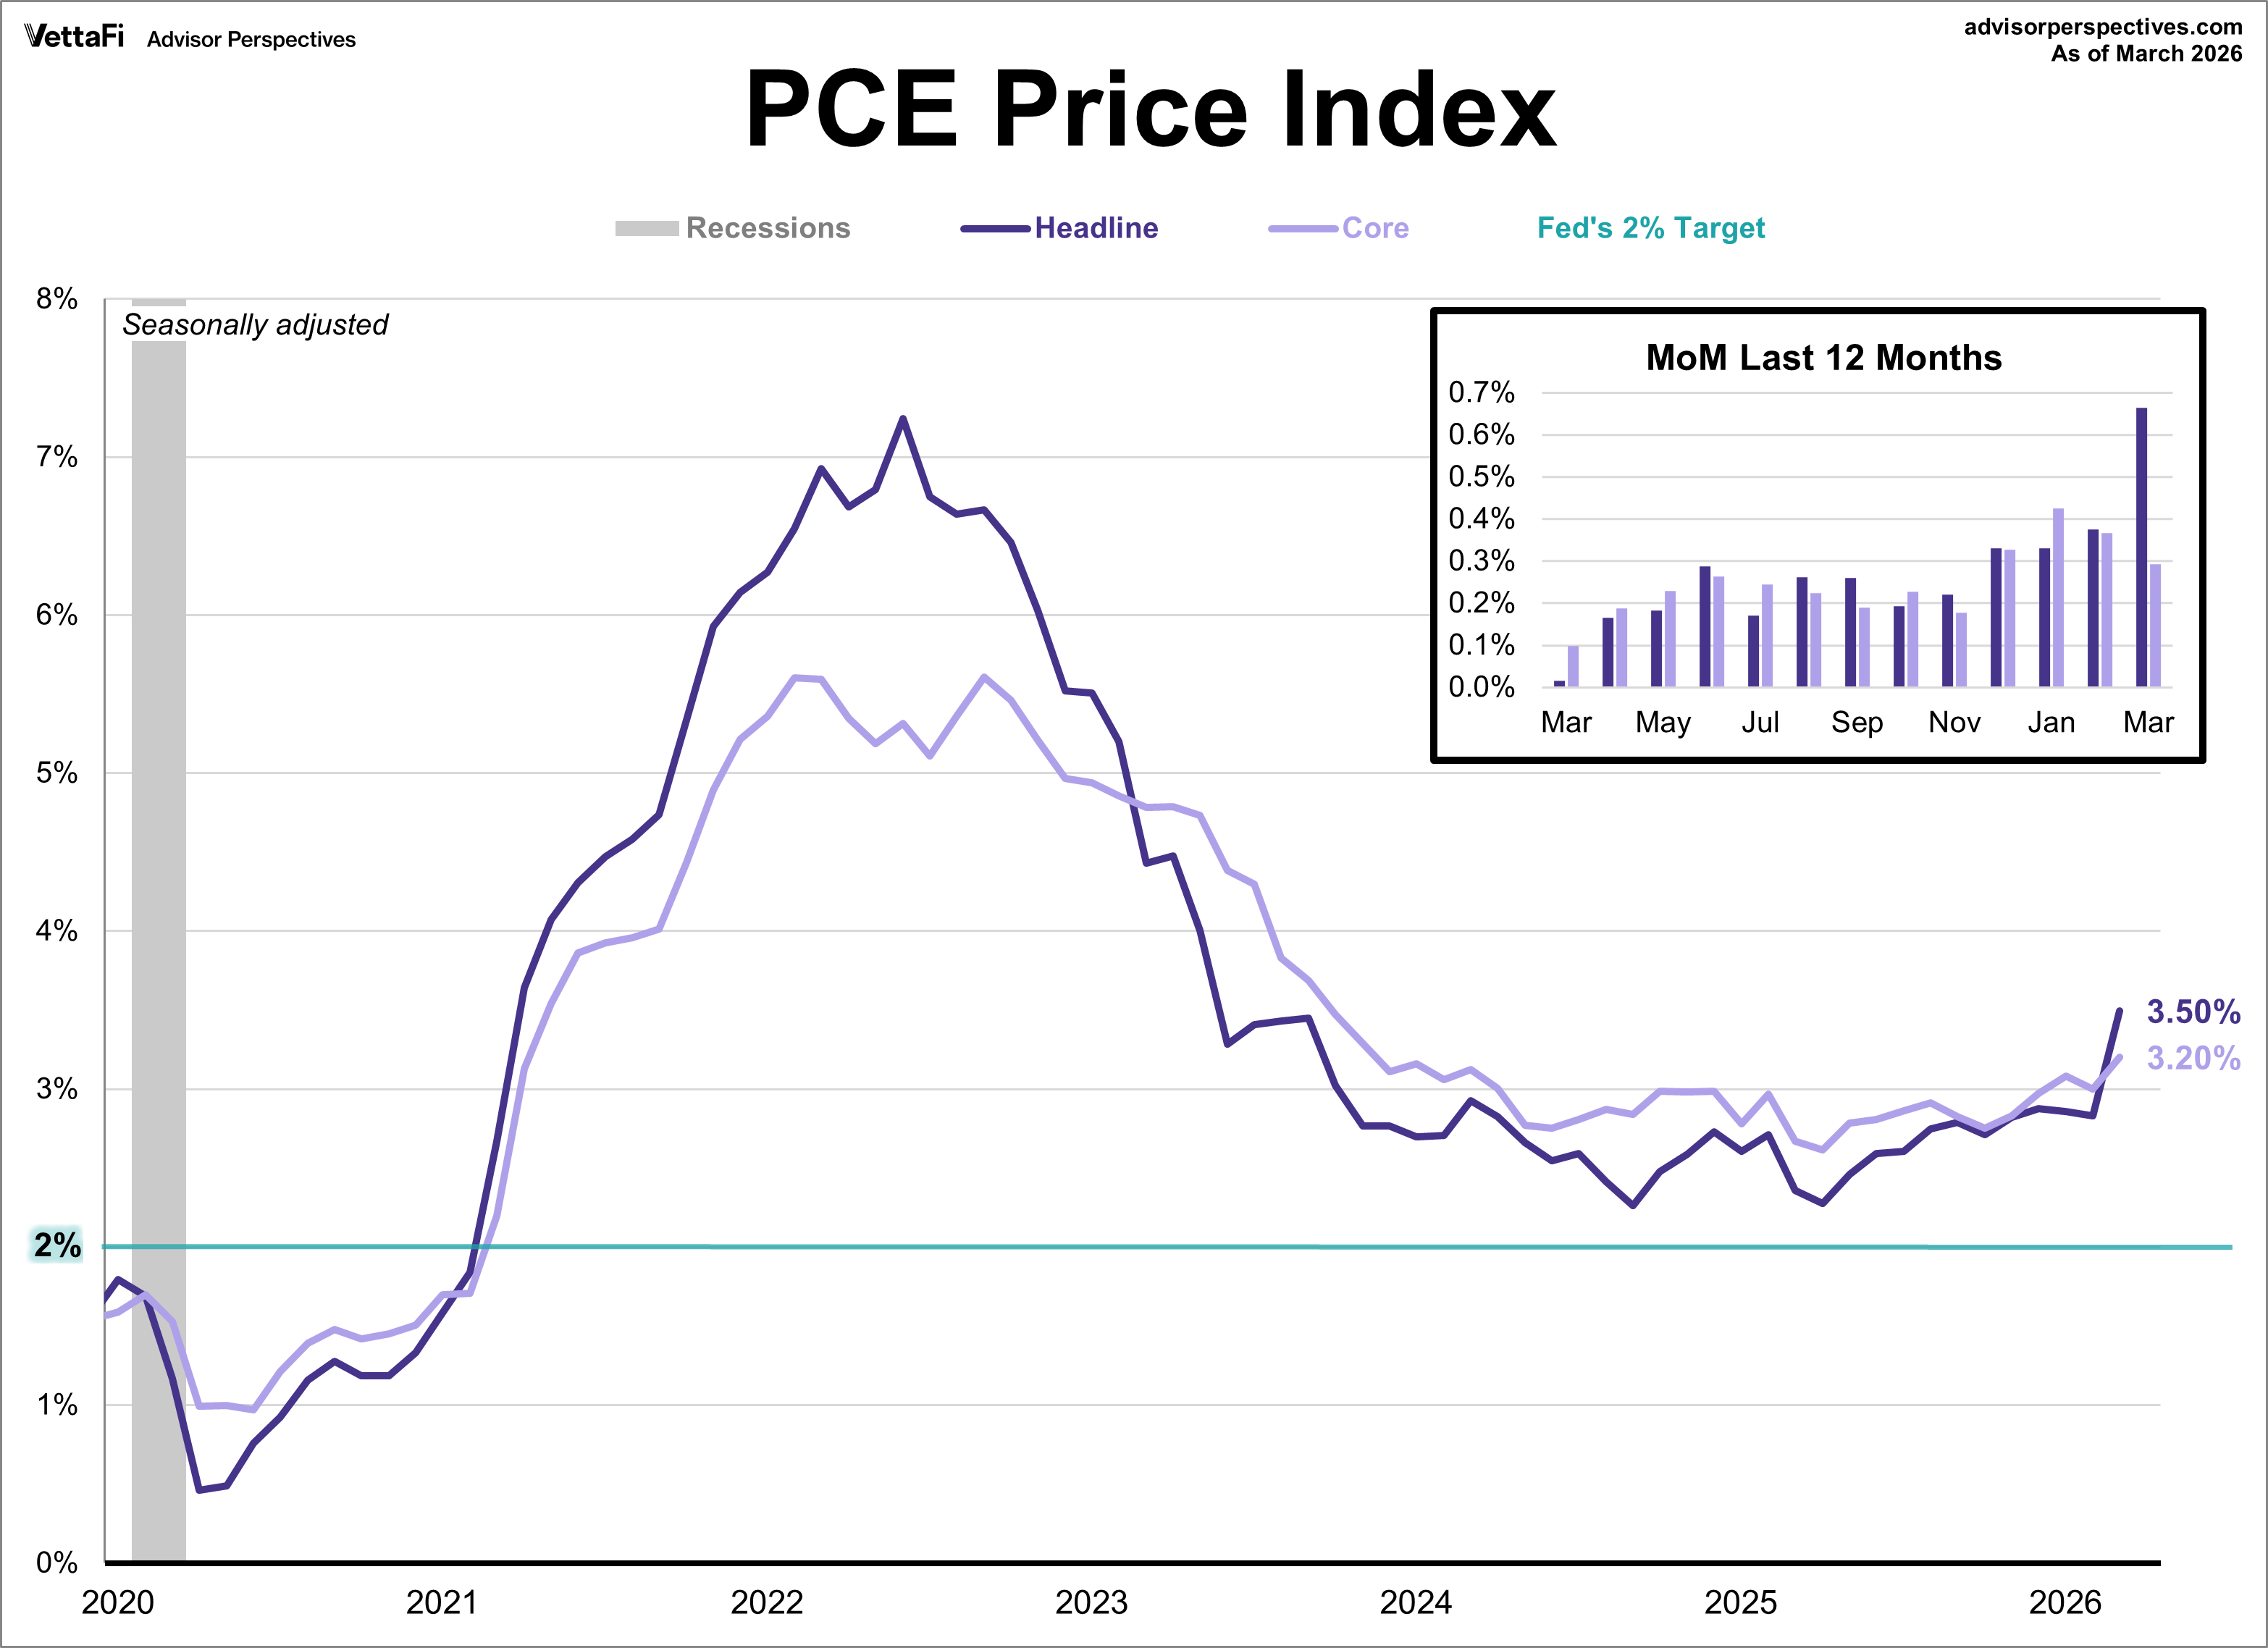
Resurgent energy costs, fueled by ongoing conflict in the Middle East, drove the Federal Reserve’s preferred inflation gauges to multi-year highs in March. The headline PCE index rose 3.5% annually, its highest level since May 2023. The growth was bolstered by a sharp 0.7% monthly jump in prices, the largest single month increase since 2022. While core PCE (which excludes volatile food and energy) rose a more modest 0.3% on a monthly basis, it still reached a 3.2% year-over-year clip. This marks a steady climb from the previous month’s 3.0% and represents the highest level for core inflation since late 2023. Although these figures matched expectations, they underscore the significant impact global instability is having on the domestic inflation trajectory.
Economic Growth
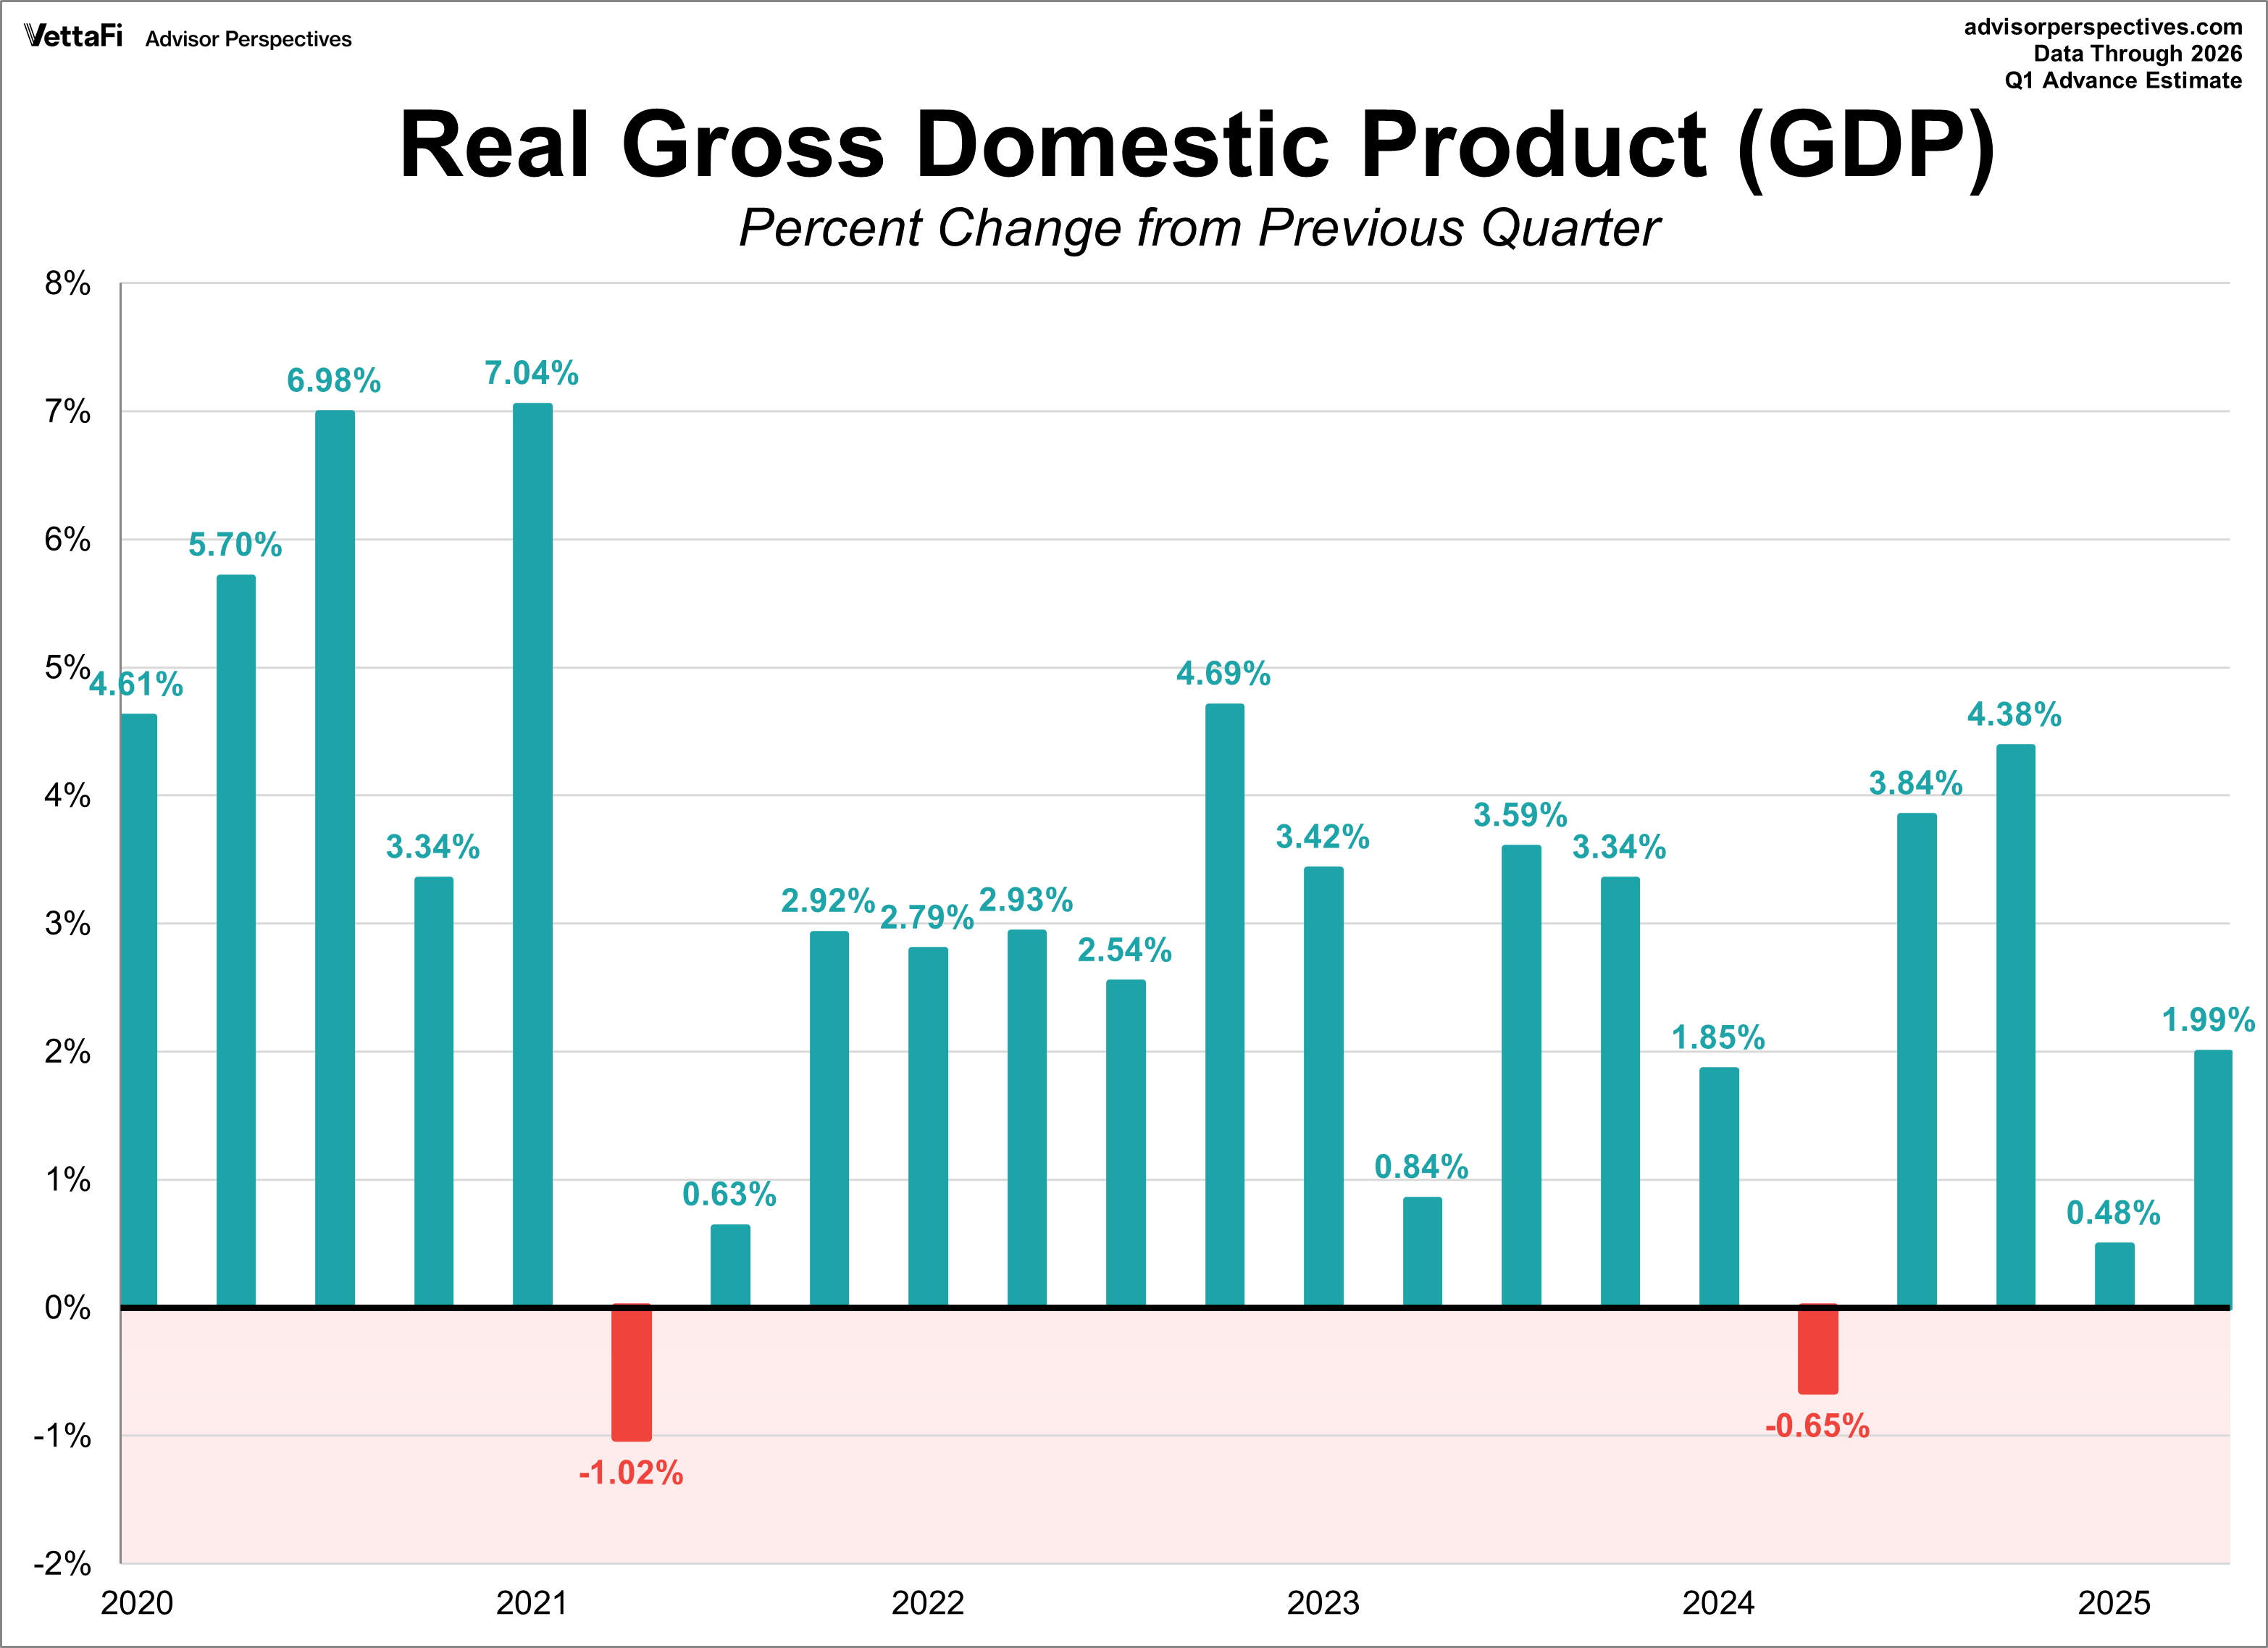
The U.S. economy showed a significant improvement at the start of 2026, according to the BEA’s advance estimate for Q1. Real GDP grew at an annualized rate of 2.0%. While this fell short of the 2.2% forecast, it represents a substantial acceleration from the 0.5% growth observed in the fourth quarter of the previous year. This expansion was primarily driven by higher consumer spending, government expenditures, exports, and business investment.
Consumer Confidence
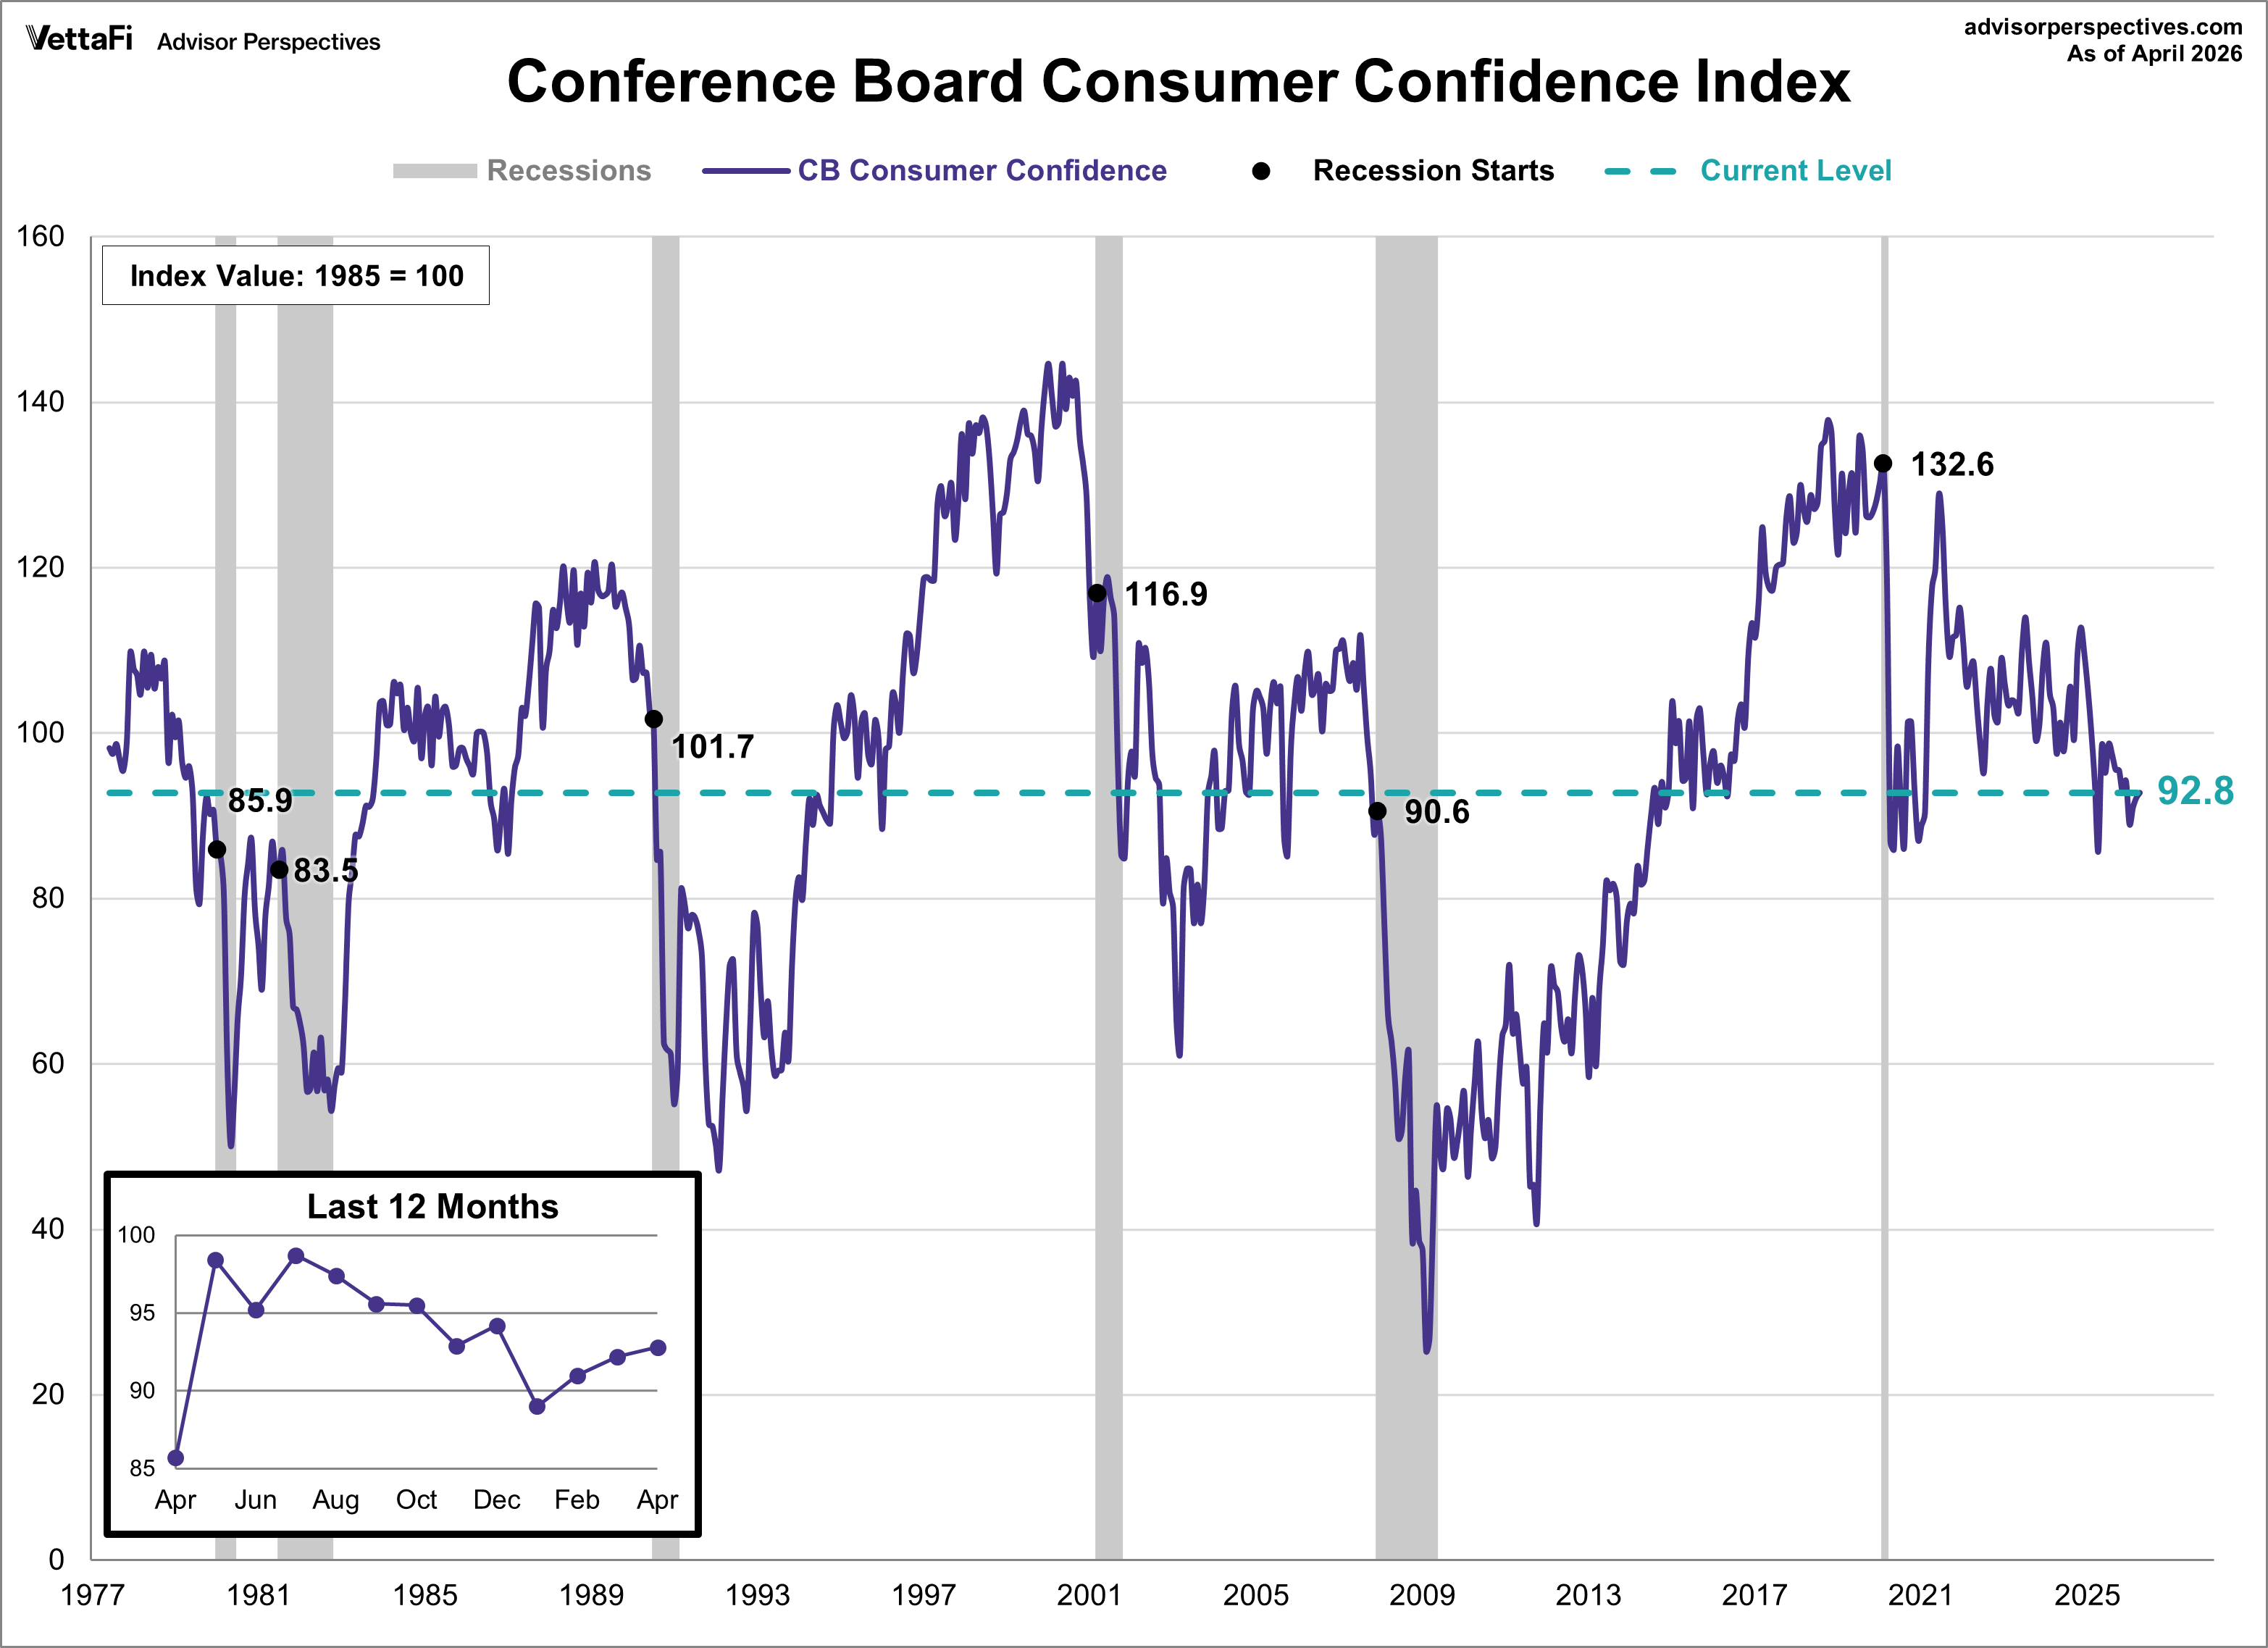
Consumer confidence edged up for the third consecutive month in April but consumers remain concerned over the impact of the Middle East conflict on their wallets.The Conference Board Consumer Confidence Index® rose 0.6 points to 92.8, its highest level of the year and above the forecast of 89.0. Perceptions of current and expected business conditions declined were offset by slight improvements in both current and expected labor market perceptions.
The Consumer Discretionary Select Sector SPDR ETF (XLY) is tied to consumer confidence.
Market Reactions
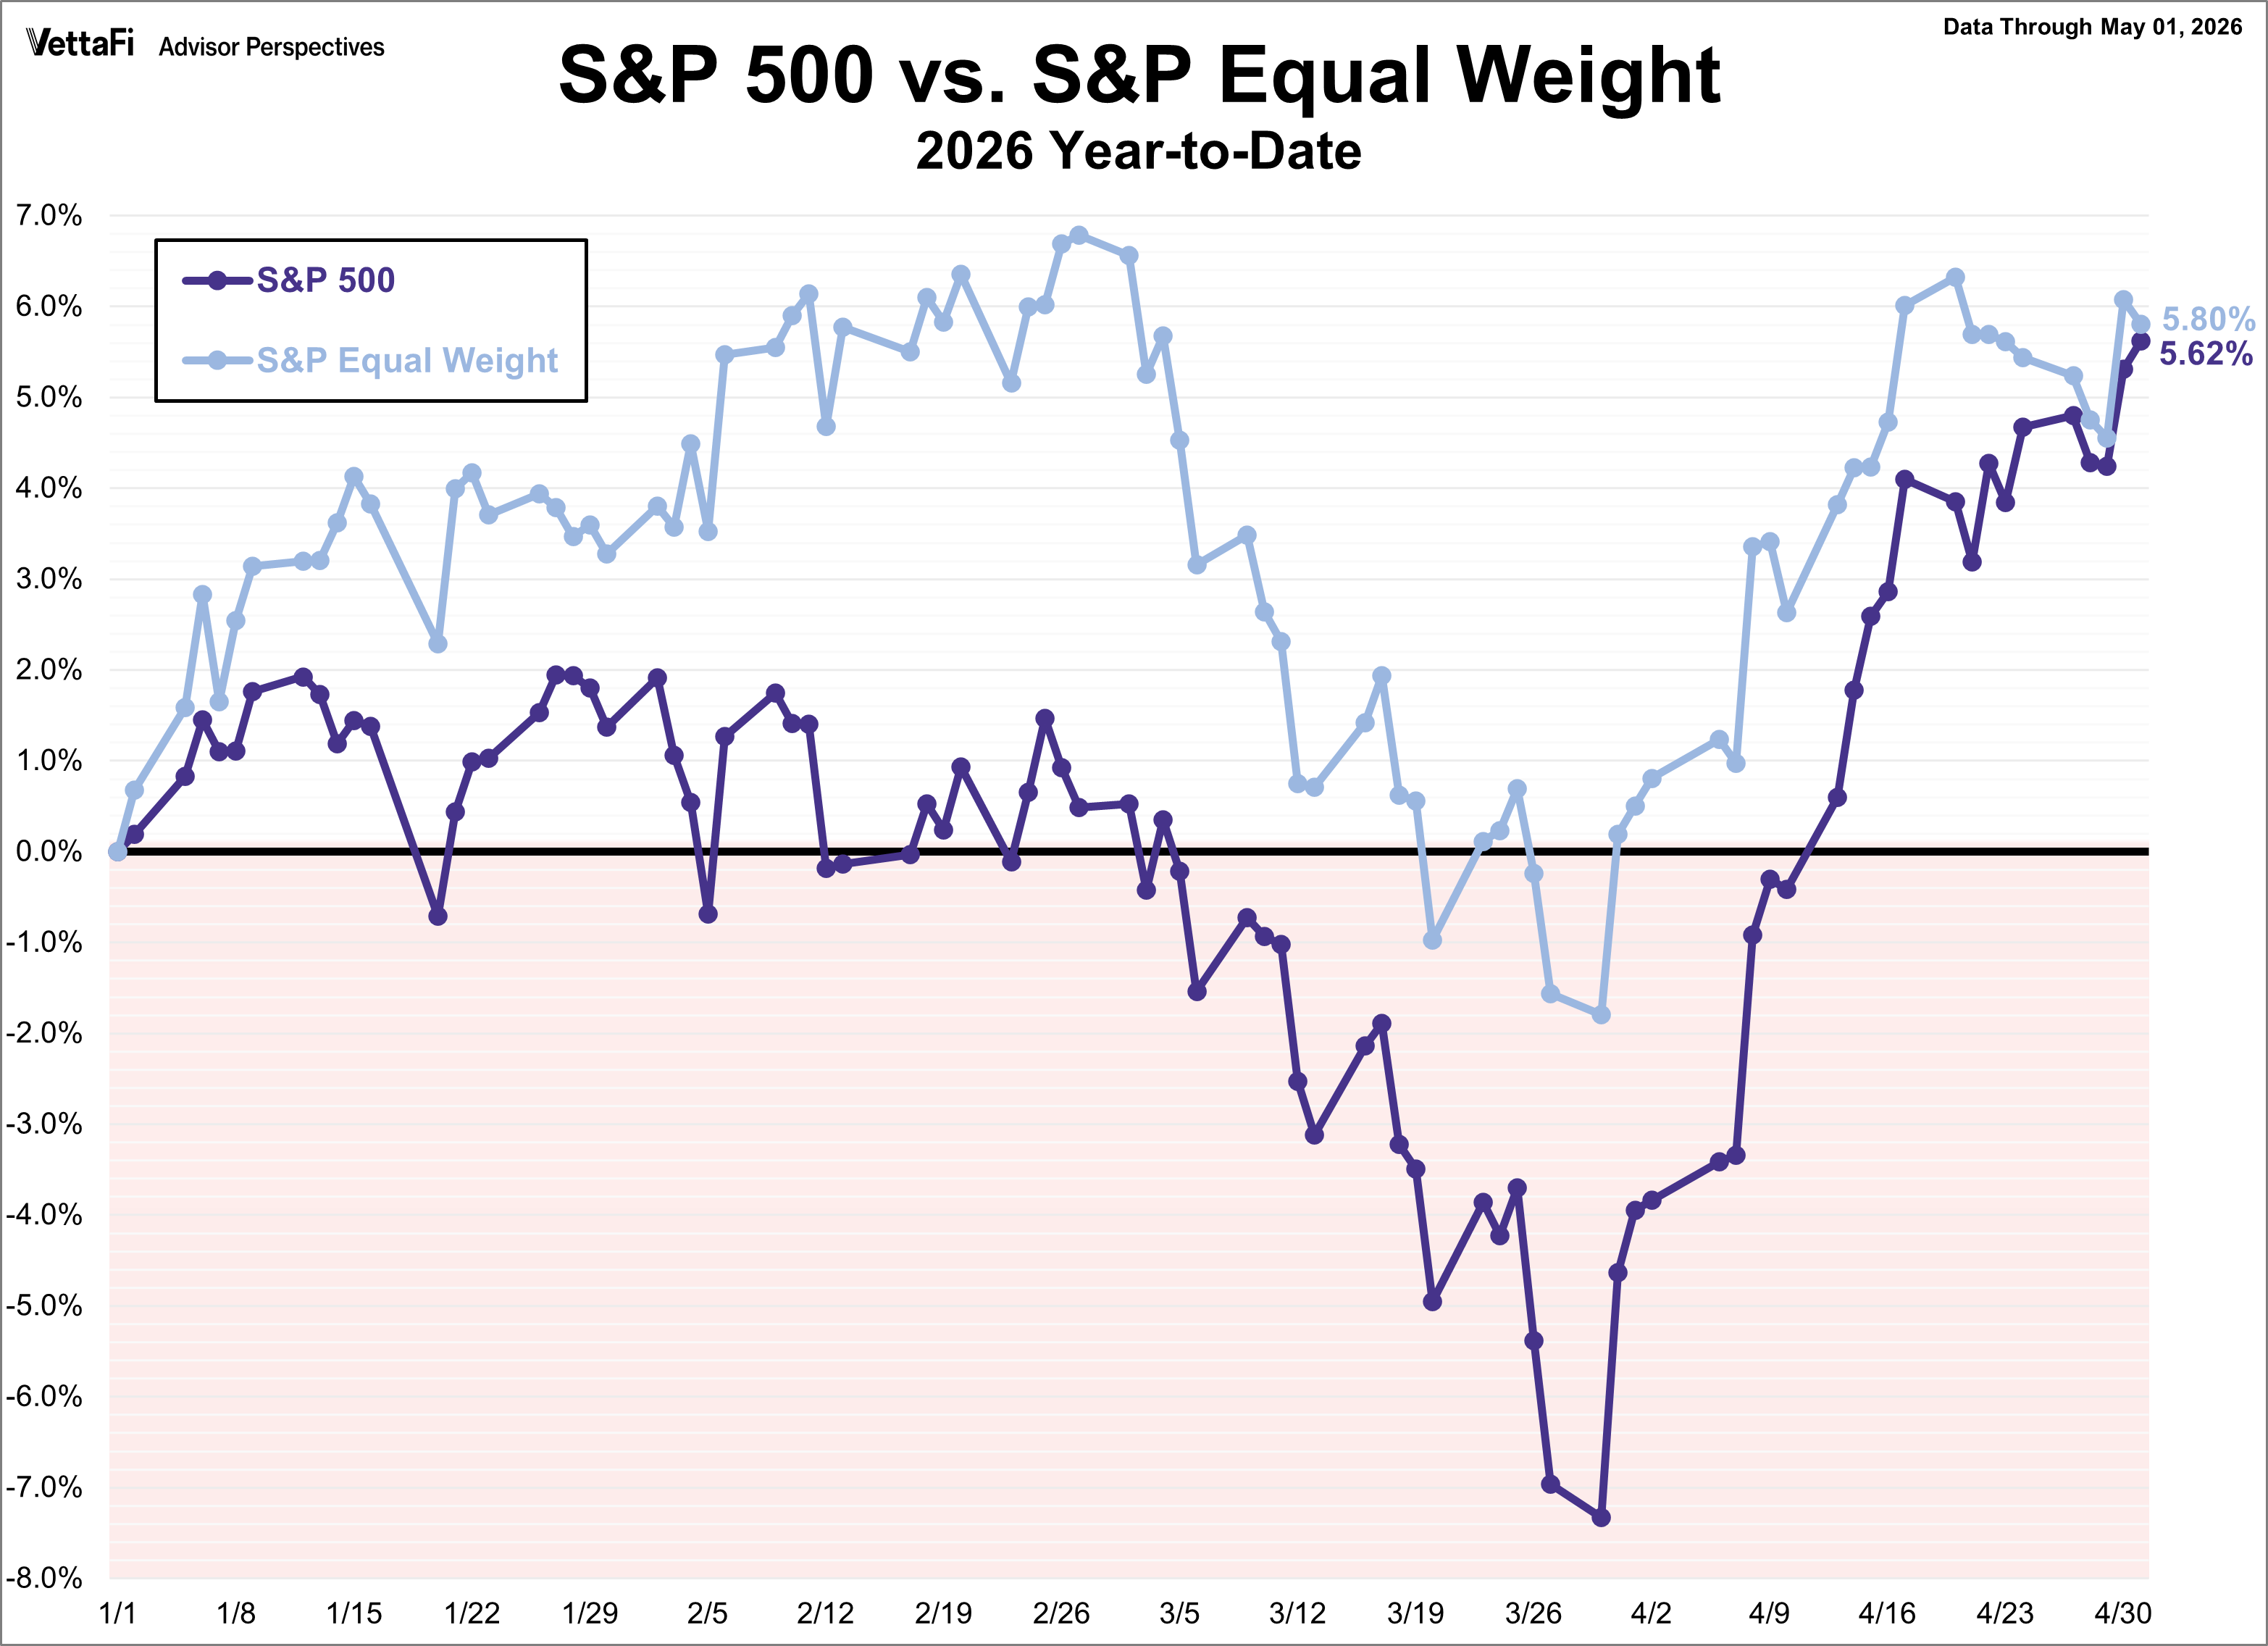
The S&P 500 closed out last week with another record high, finishing up 0.9% from the previous week. This marks the fifth straight weekly gain for the index, the longest streak since October 2024. As a result, the SPDR S&P 500 ETF Trust (SPY) rose 0.9% last week. Meanwhile, the S&P Equal Weight Index was up 0.3% from the previous week and the Invesco S&P 500® Equal Weight ETF (RSP) rose 0.4%.
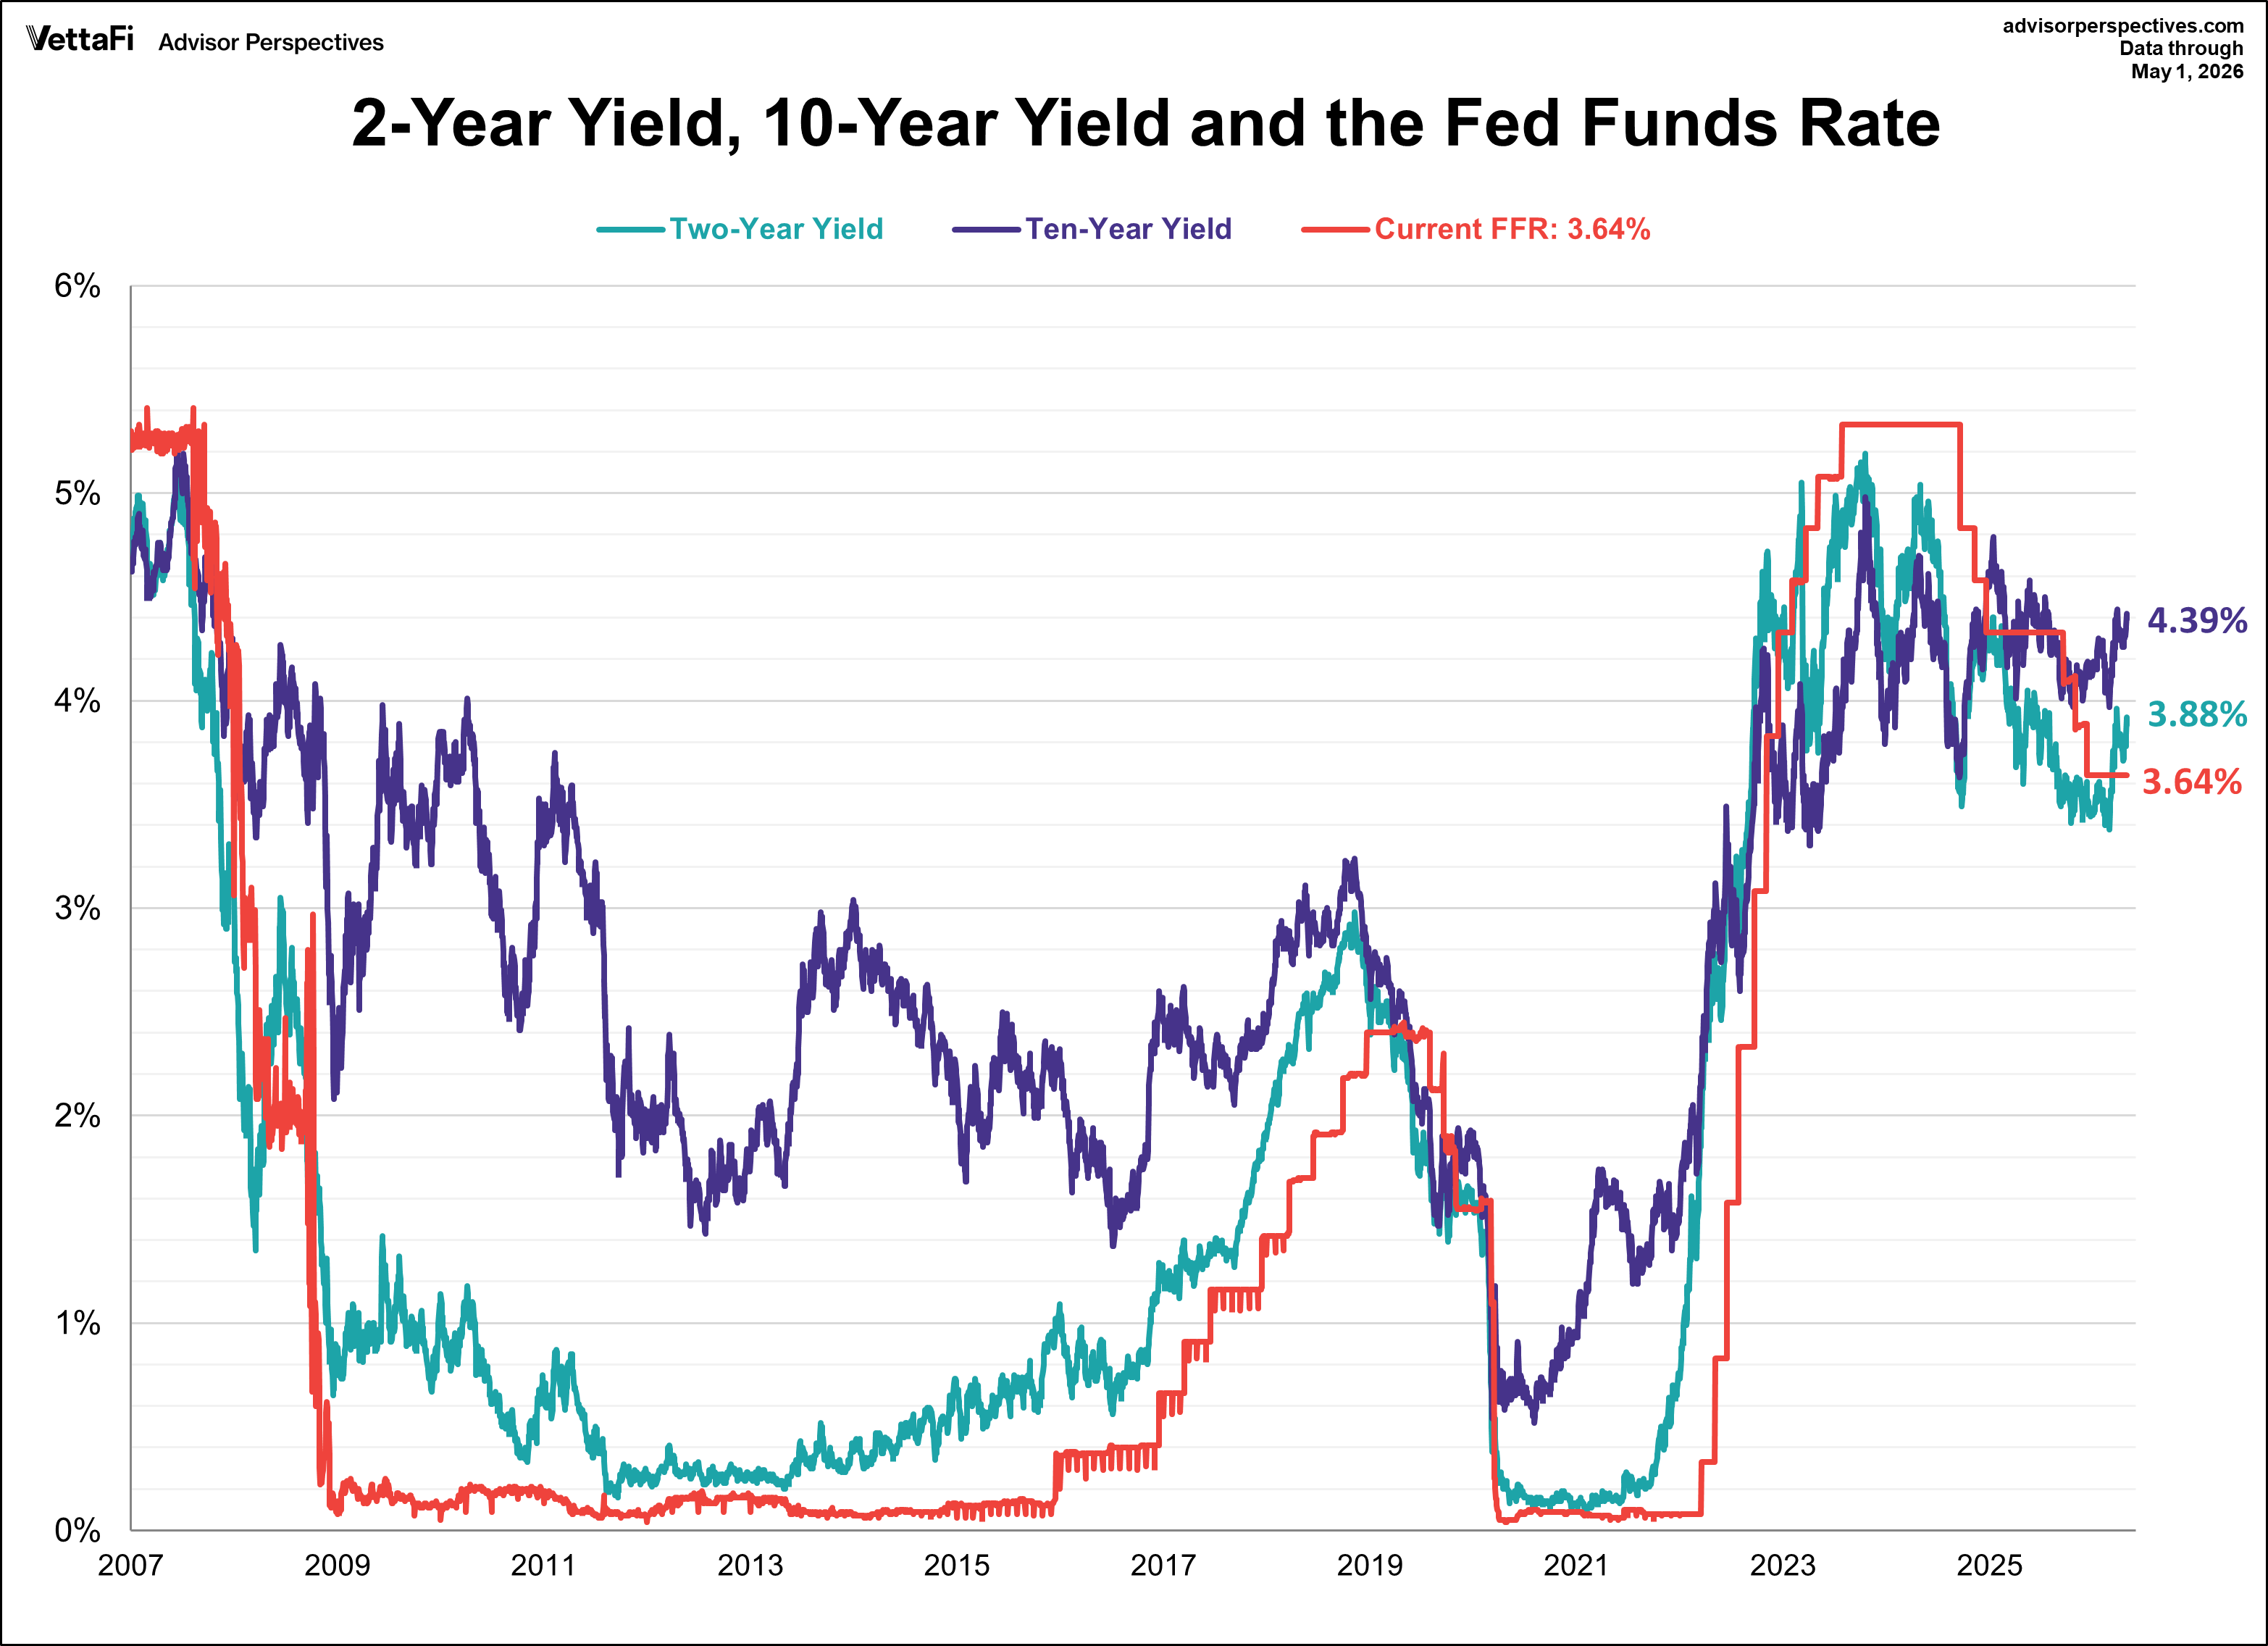
The 10-year Treasury yield finished the week at 4.39%, while the 2-year note finished at 3.88%.
Economic Data in the Week Ahead
-
- Monday: No notable data
- Tuesday: Trade Balance (Mar), S&P Global Services PMI (Apr), ISM Services PMI (Apr), New Home Sales (Mar), JOLTS Job Openings (Mar)
- Wednesday: ADP Employment Report (Apr)
- Thursday: Weekly Jobless Claims
- Friday: BLS Employment Report (Apr), University of Michigan Consumer Sentiment Index (May)
Originally published on Advisor Perspectives
For more news, information, and strategy, visit ETF Trends.